
Accessing Clinical Feedback Reports

In Mirah, there are numerous ways to access patient reports in just a few clicks.

Dashboard - Recently Completed​

Upon logging in, the user is taken to the Recently Completed portion of the Dashboard, which shows recently completed measures for that user and any users they supervise.

If the client is listed on the Recently Completed tab, click on the Report button to access the most recent feedback report:
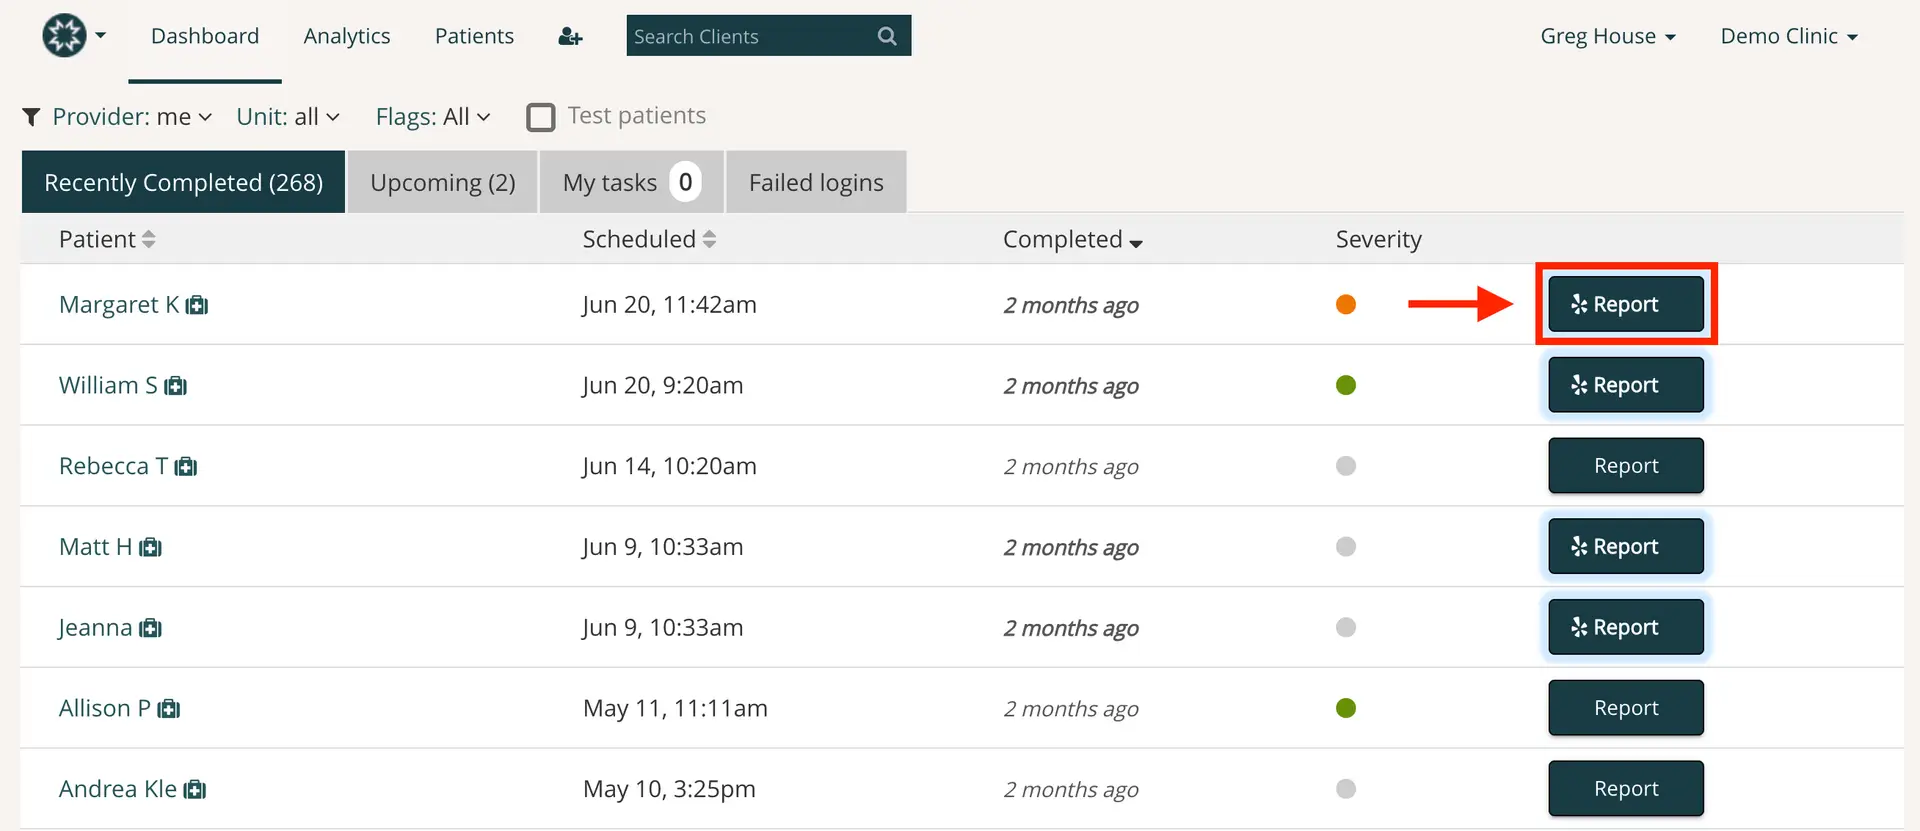
The screenshot displays the 'Recently Completed' tab within the Mirah Measurement-Based Care platform, showing a list of patients with their respective assessment details. The top navigation bar includes options for Dashboard, Analytics, and Patients, along with a search bar labeled 'Search Clients' on the right. The user is identified as Greg House from Demo Clinic. Filters are available for Provider, Unit, and Flags, with a checkbox for 'Test patients'. The table lists patients by name, with columns for Scheduled date and time, Completed status, and Severity indicated by colored dots. Each row has a 'Report' button on the far right, allowing users to access detailed clinical feedback reports for each patient. The 'Report' button for Margaret K is highlighted with a red box and arrow, indicating it as the focal point of the screenshot.

Search Clients​

You can search for patients directly by name from anywhere in Mirah using the Search Clients function in the top navigation bar.

The screenshot displays the Mirah Measurement-Based Care interface, specifically the section for accessing clinical feedback reports. At the top, there is a navigation bar with options for Dashboard, Analytics, and Patients, along with a user profile dropdown labeled 'Greg House' and a clinic selection dropdown labeled 'Demo Clinic'. Below the navigation bar, there is a search bar labeled 'Search Clients' on the right side, allowing users to search for specific clients. The main section of the screen shows tabs for 'Recently Completed', 'Upcoming', 'My tasks', and 'Failed logins', with 'Recently Completed' being active and showing 268 entries. The table below lists patients with columns for Patient, Scheduled, Completed, and Severity. The row displayed shows a patient named Margaret K, with a scheduled time of Jun 20, 11:42 am, completed 2 months ago, and a severity indicator. On the right side of the row, there is a 'Report' button for accessing detailed reports.

Type in the patient name, hit enter, and it will pull up the Patients page with all search results matching the name that the user has permissions to see. Click on the report button to pull up the most recent report.
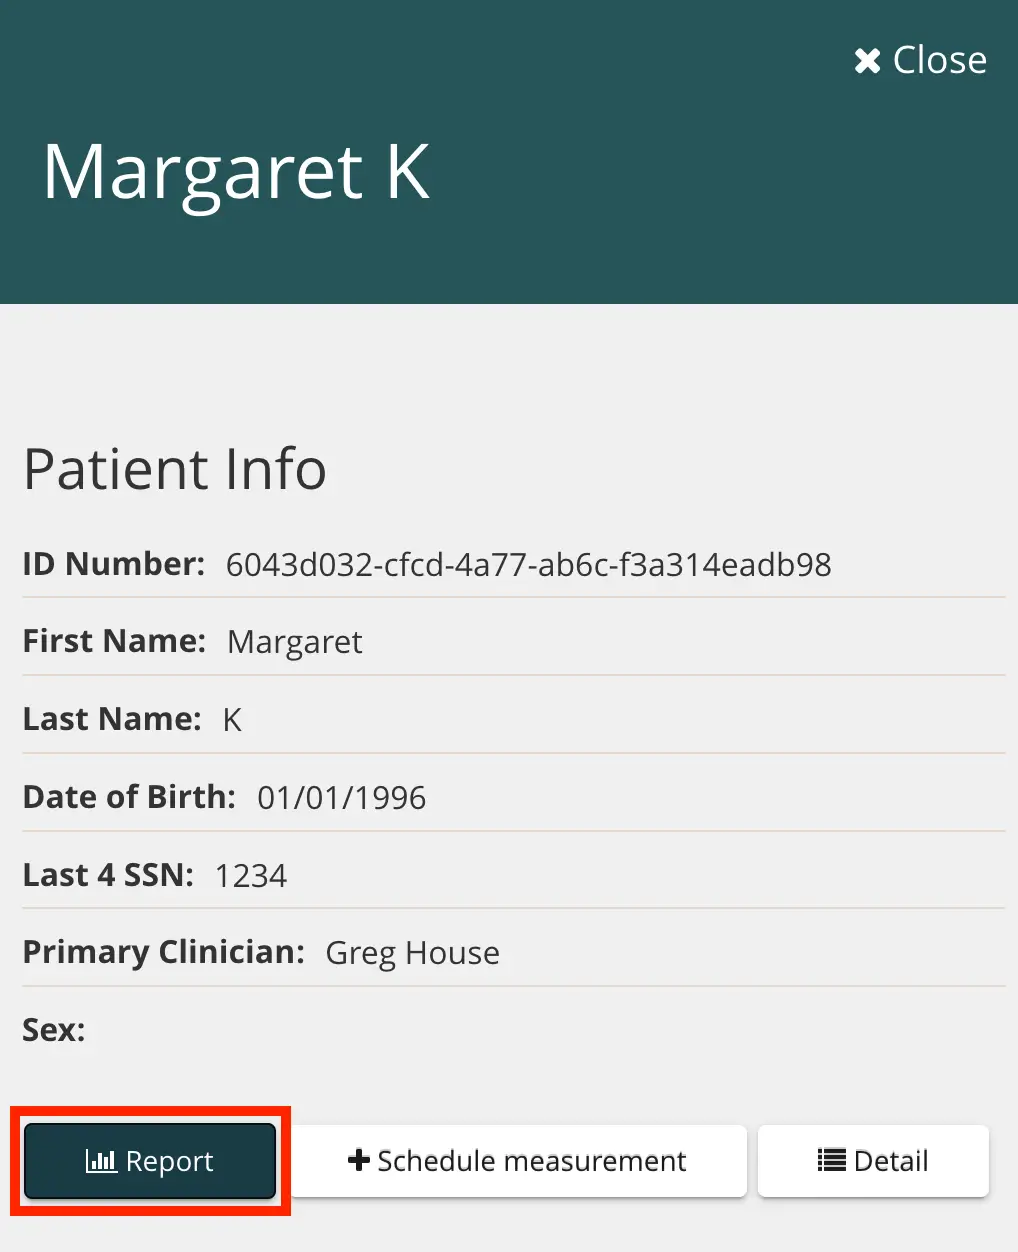
The screenshot displays the patient information screen for Margaret K within the Mirah Measurement-Based Care platform. The screen provides detailed patient info including ID Number, First Name, Last Name, Date of Birth, Last 4 SSN, Primary Clinician, and Sex. At the top right corner, there is a 'Close' button to exit the screen. At the bottom, there are three buttons: 'Report' on the left, which likely generates or accesses clinical feedback reports; '+ Schedule measurement' in the center, which is used to schedule new measurements for the patient; and 'Detail' on the right, which may provide more detailed patient information or history.

Patients​

The Patients section pulls up all clients the user has permission to access. The user can filter the patient list by Provider, Unit, or Flags. Click on the report button to pull up the most recent report.
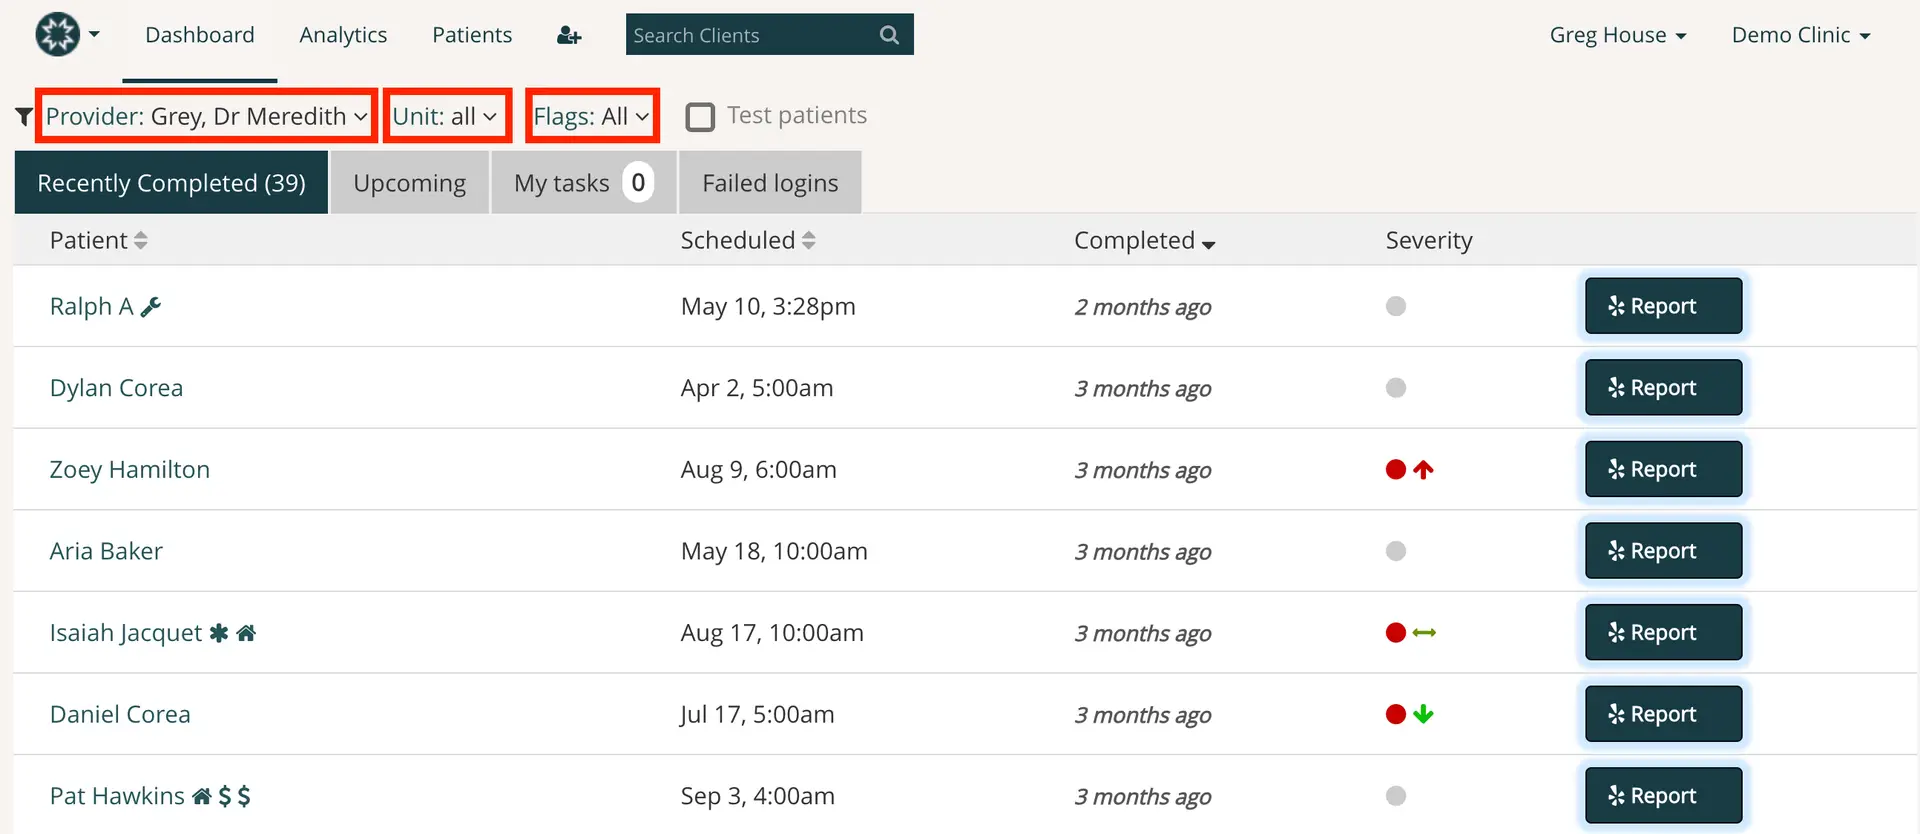
The screenshot displays the 'Working with Patients' section of the Mirah Measurement-Based Care platform, specifically focusing on accessing clinical feedback reports. At the top, there is a navigation bar with tabs for Dashboard, Analytics, and Patients, along with a search bar labeled 'Search Clients' on the right. User information is displayed as 'Greg House' and 'Demo Clinic' in the top-right corner. Below the navigation bar, there are dropdown filters for 'Provider: Grey, Dr Meredith', 'Unit: all', and 'Flags: All', allowing users to filter patient data. A checkbox labeled 'Test patients' is available for selection. The main content area is divided into tabs: 'Recently Completed', 'Upcoming', 'My tasks', and 'Failed logins', with 'Recently Completed' being active and showing 39 entries. The table lists patients with columns for 'Patient', 'Scheduled', 'Completed', and 'Severity'. Each patient row includes a 'Report' button on the right for accessing detailed reports. Severity indicators are shown as colored dots with arrows, indicating the status of each patient's condition.

Patient Detail​

Current and prior feedback reports can be accessed from the Patient Detail page. Click on Detail from the Patients page to pull up Patient Details.
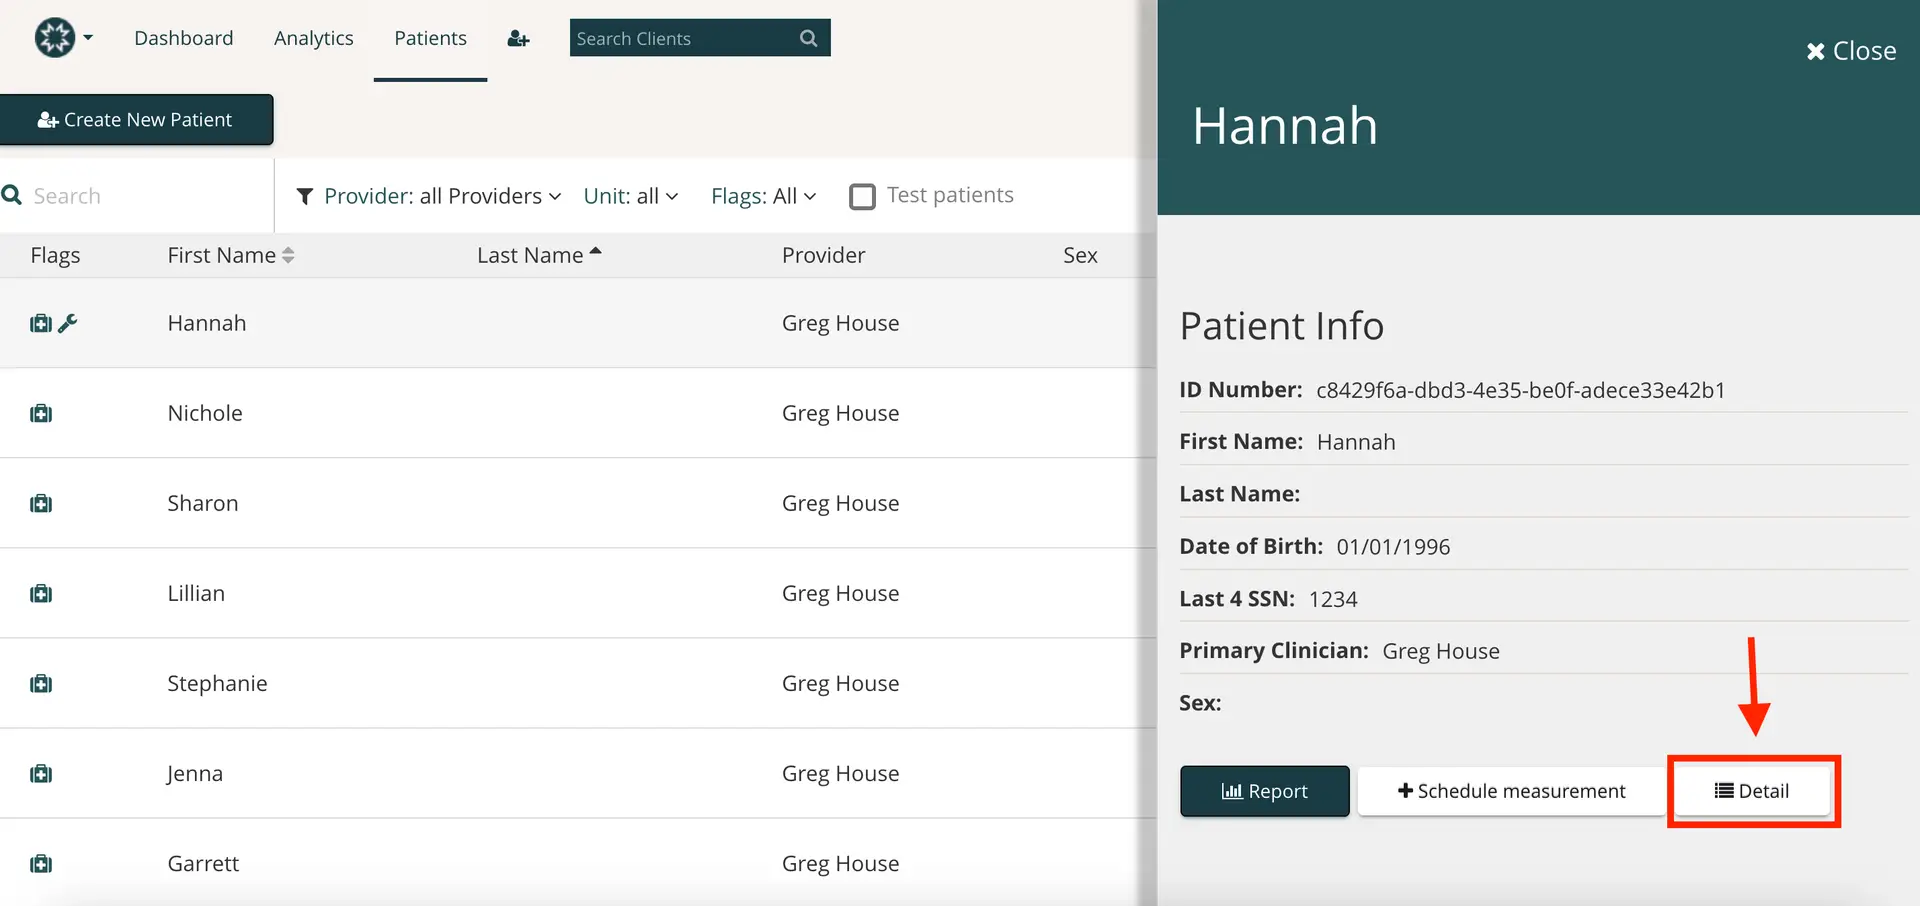
The screenshot displays the 'Patients' section of the Mirah Measurement-Based Care platform, where users can manage patient information and access clinical feedback reports. The top navigation bar includes options for 'Dashboard', 'Analytics', and 'Patients', with a search bar labeled 'Search Clients' on the right. Below, there is a 'Create New Patient' button on the left. The main area shows a list of patients with columns for 'Flags', 'First Name', 'Last Name', and 'Provider', with 'Greg House' listed as the provider for all patients. The right panel shows detailed information for a selected patient named Hannah, including 'ID Number', 'First Name', 'Last Name', 'Date of Birth', 'Last 4 SSN', 'Primary Clinician', and 'Sex'. At the bottom of this panel, there are three buttons: 'Report', 'Schedule measurement', and 'Detail', with the 'Detail' button highlighted by a red arrow, indicating its importance or the next step in the workflow.

Patient Details can also be accessed by clicking on the client’s name anywhere in the platform, including on the Dashboard.
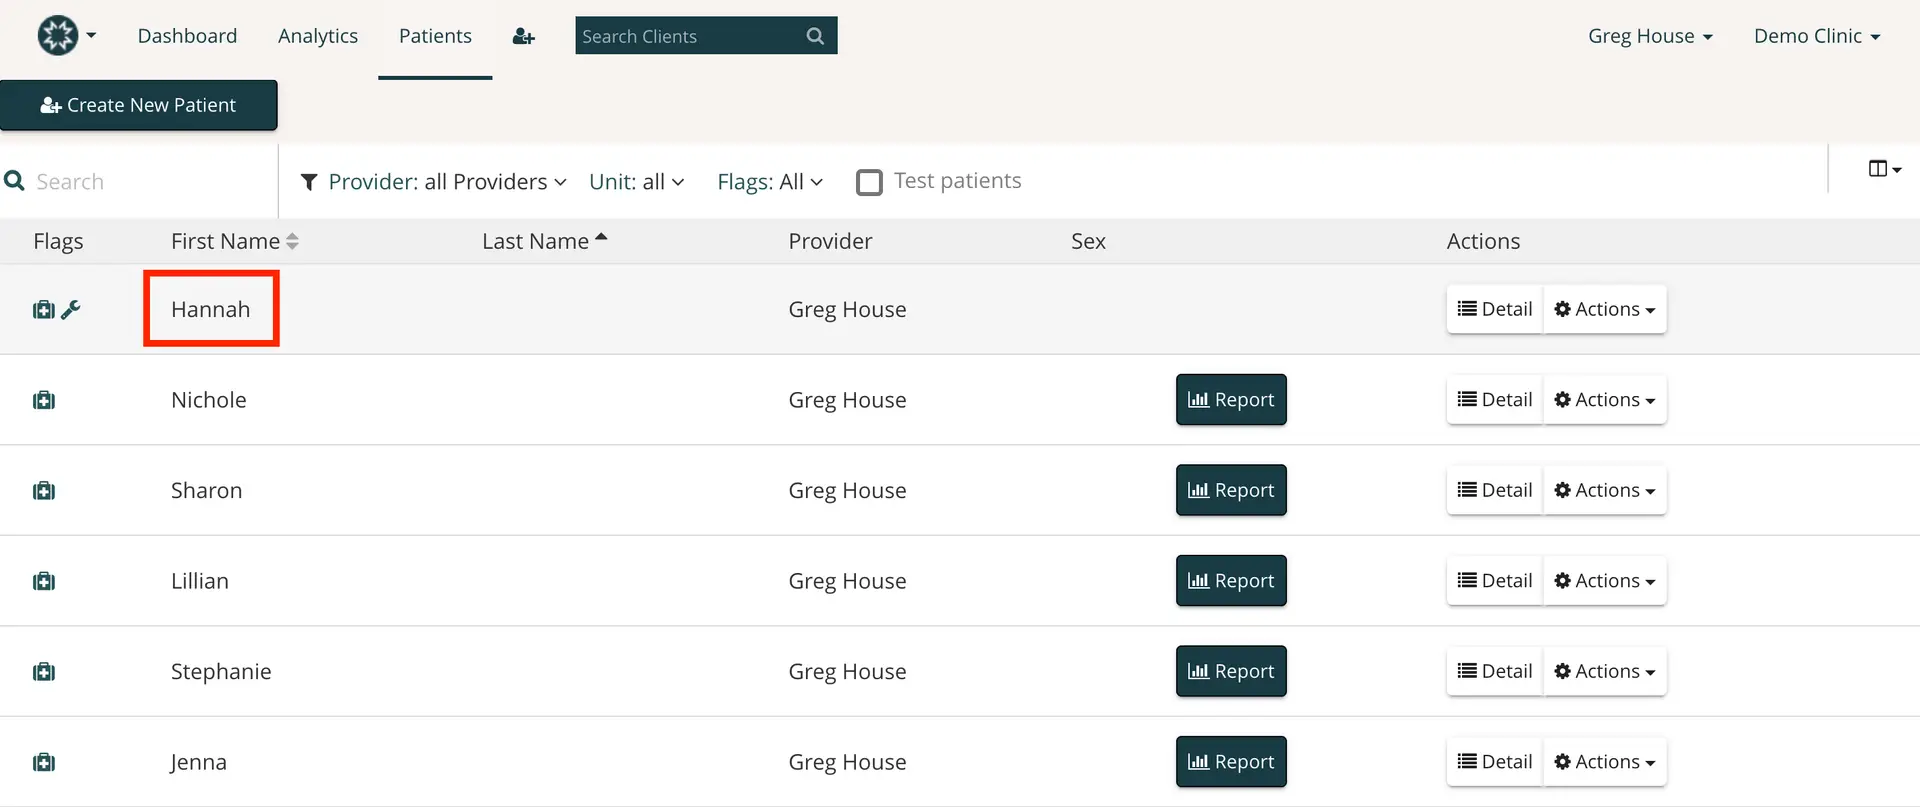
The screenshot displays the 'Patients' tab within the Mirah Measurement-Based Care platform, which is part of the workflow for accessing clinical feedback reports. At the top, there is a navigation bar with options for Dashboard, Analytics, and Patients, along with a search bar labeled 'Search Clients' on the right. The 'Create New Patient' button is prominently located on the left side below the navigation bar. Below this, there is a filter bar allowing users to filter by Provider, Unit, and Flags, with a checkbox option for 'Test patients'. The main table lists patients with columns for Flags, First Name, Last Name, Provider, Sex, and Actions. Each row represents a patient, with the first row highlighted in red around the first name 'Hannah'. The Actions column contains buttons for 'Detail' and a dropdown labeled 'Actions', while the 'Report' button is available for generating reports. The interface is designed to streamline patient management and report access for providers.

On the Patient detail page, click the Report button at the top for the most recent feedback report. To access prior reports, click anywhere in the box for the prior session.
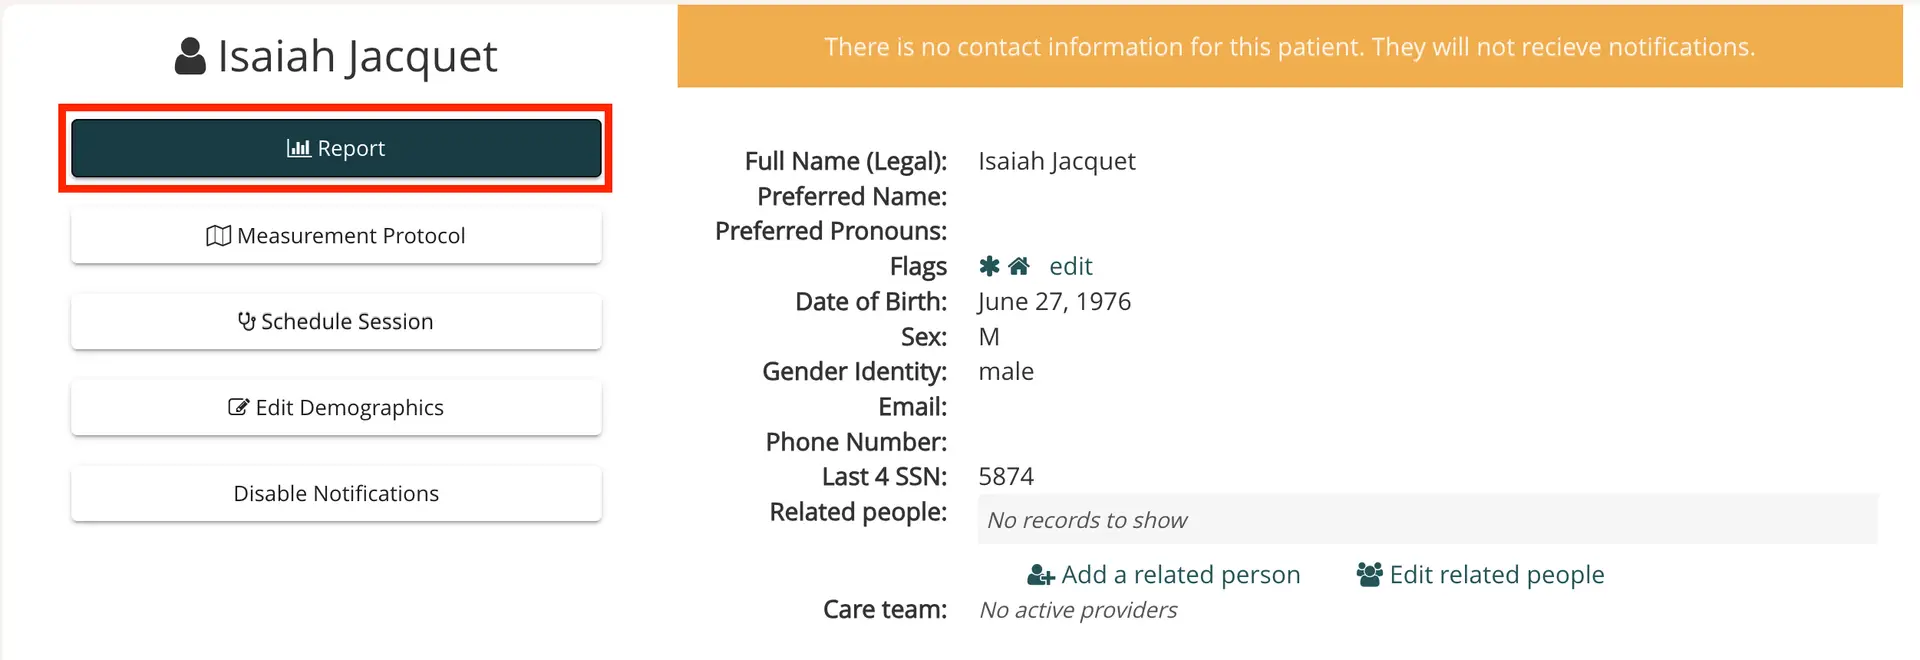
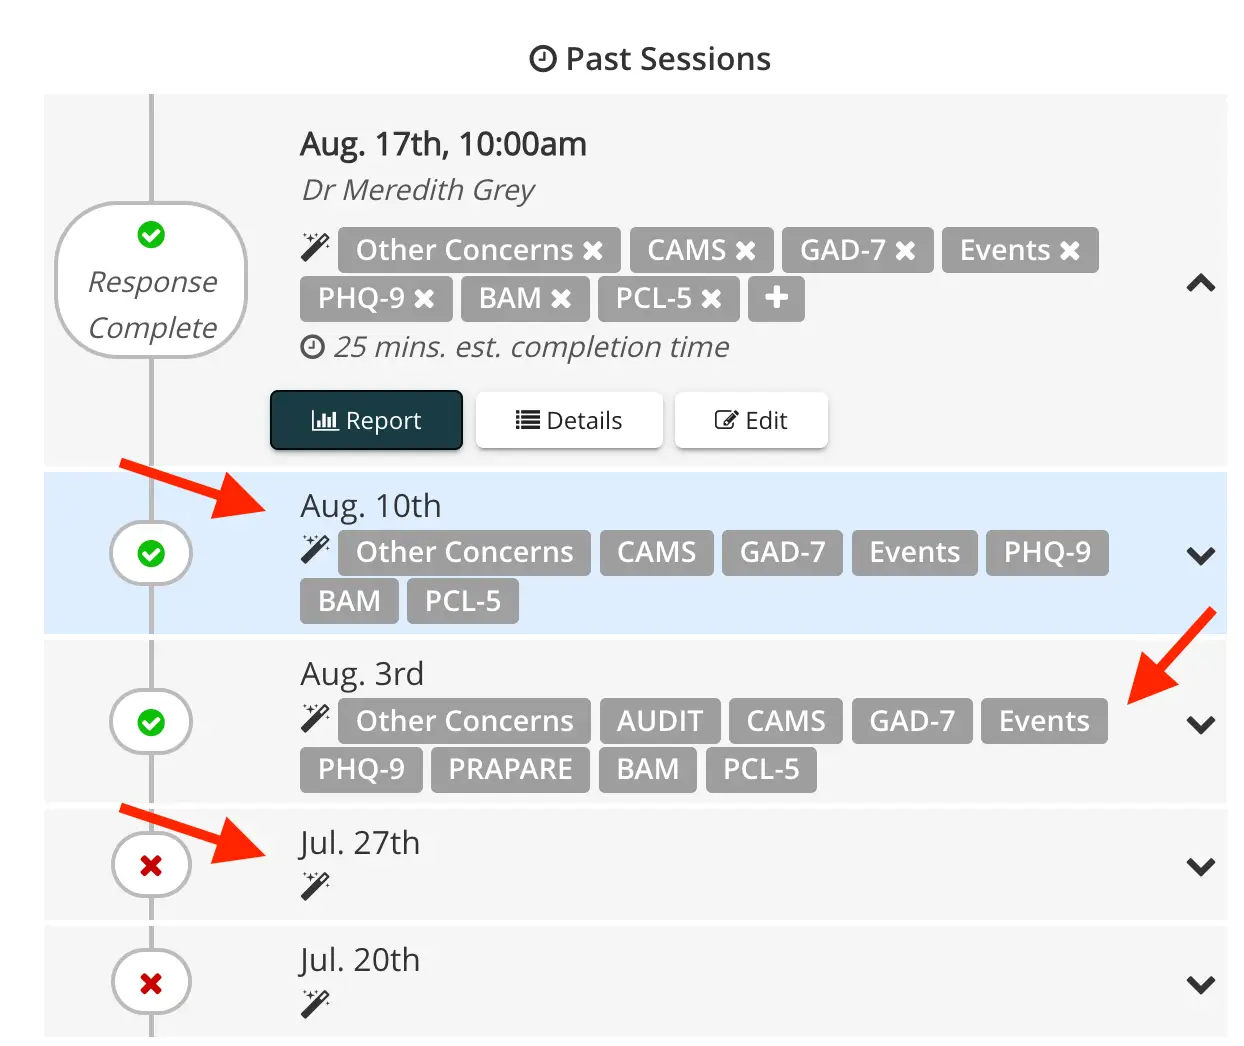
The screenshot displays the patient profile page for Isaiah Jacquet within the Mirah Measurement-Based Care platform. At the top left, the patient's name is prominently displayed with an icon indicating a user profile. Below the name, there is a 'Report' button highlighted in dark green, which is used to access clinical feedback reports. This button is located at the top left of the screen. Below the 'Report' button, there are several options including 'Measurement Protocol', 'Schedule Session', 'Edit Demographics', and 'Disable Notifications', each serving specific functions related to patient management. On the right side, the patient's detailed information is listed, including full legal name, preferred name, preferred pronouns, flags, date of birth, sex, gender identity, email, phone number, and the last four digits of the SSN. There is a note indicating that there is no contact information for this patient, and they will not receive notifications. The section also includes options to 'Add a related person' and 'Edit related people', with a note stating 'No active providers'.The screenshot displays the 'Past Sessions' section of the Mirah Measurement-Based Care platform, showing a timeline of patient sessions with Dr. Meredith Grey. Each session is marked with a status icon indicating whether the response is complete or incomplete. The session on August 17th at 10:00 am is marked as 'Response Complete' with a green check icon, and includes various assessments such as Other Concerns, CAMS, GAD-7, Events, PHQ-9, BAM, and PCL-5, along with an estimated completion time of 25 minutes. Below this, there are buttons labeled 'Report', 'Details', and 'Edit' for further actions, located centrally under the session details. The session on August 10th is highlighted in blue, indicating selection, and also marked as complete with a green check icon. Sessions on August 3rd and July 27th are listed with their respective assessments, with July 27th marked as incomplete with a red cross icon. Each session has a dropdown arrow on the right side for expanding details.

The section will expand, and then click on the Report button to see the feedback report for that session.
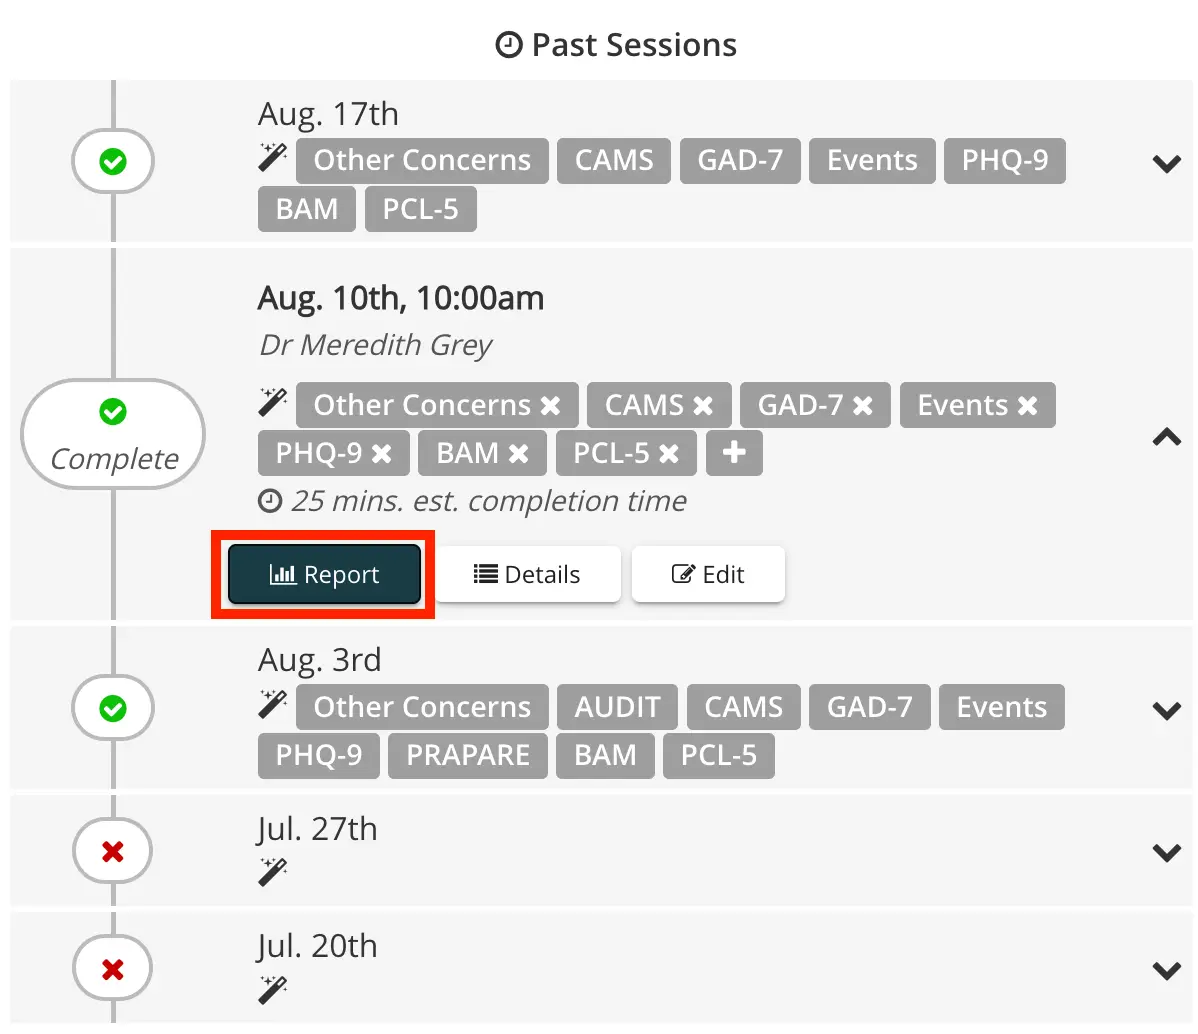
The screenshot displays the 'Past Sessions' section of the Mirah Measurement-Based Care platform, showcasing a timeline of patient sessions. Each session is marked with a status icon indicating completion or pending status. The session on August 10th at 10:00 am with Dr. Meredith Grey is expanded, showing various assessments such as Other Concerns, CAMS, GAD-7, Events, PHQ-9, BAM, and PCL-5, with some marked as completed. The estimated completion time is noted as 25 minutes. Below the assessments, there are three buttons: 'Report' highlighted in blue on the left, 'Details' in the center, and 'Edit' on the right, allowing users to generate reports, view session details, or edit session information respectively.