
How to Use the Daily Progress Tracker

The Daily Progress Tracker feature must be enabled in your instance. If you would like to use this feature, contact Mirah support (support@mirah.com).

The daily progress tracker can help show you how the time you've logged each day contributes to your monthly implementation targets. In order to use the tracker, you need to have a personal billed minutes implementation target set up to track progress against. For help setting up the target, contact support@mirah.com.

Once you have a target configured, you'll see this at the top of your dashboard:
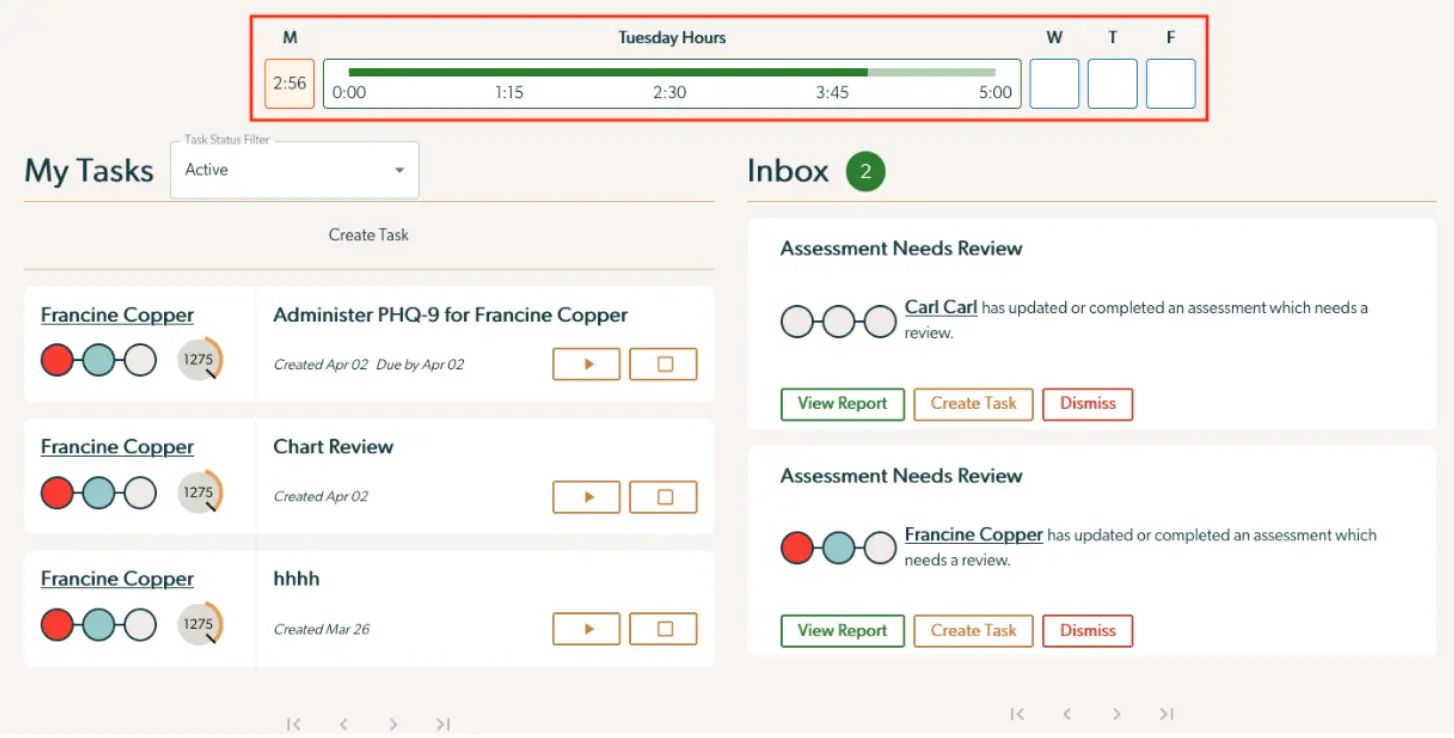
The screenshot displays the Daily Progress Tracker interface within the Mirah Collaborative Care platform, focusing on task management and assessment review. At the top, there is a horizontal bar labeled 'Tuesday Hours' showing time allocation for the day, with segments marked at 0:00, 1:15, 2:30, 3:45, and 5:00 hours. Days of the week are indicated above the bar, with 'M' highlighted and 'T' partially filled, while 'W', 'T', and 'F' are empty. Below, the screen is divided into two main sections: 'My Tasks' on the left and 'Inbox' on the right. 'My Tasks' includes a dropdown filter for task status, set to 'Active', and a 'Create Task' button. Listed tasks for Francine Copper include 'Administer PHQ-9', 'Chart Review', and 'hhh', each with a play button and a square button for actions. The 'Inbox' section shows 'Assessment Needs Review' notifications for Carl Carl and Francine Copper, each with a 'View Report', 'Create Task', and 'Dismiss' button for managing assessments.

The large bar in the middle shows the progress towards your target for the current day, while the small boxes on each side show summary information about the other days in the current week. The bar and boxes will change their appearance as you progress towards the daily goal:

The screenshot displays a Daily Progress Tracker used in the Mirah Collaborative Care platform, showcasing different progress levels towards a target. It is divided into four sections, each representing a range of target completion: Less than 35%, 35-70%, 70-100% (On Track), and More than 100%. Each section contains a horizontal progress bar with time markers at 0:00, 1:15, 2:30, 3:45, and 5:00, indicating the elapsed time towards the target. The progress bars are color-coded: red for less than 35%, orange for 35-70%, green for 70-100%, and a darker green for more than 100%. To the right of each progress bar, there is a time box displaying the exact time spent, with values of 1:01, 2:56, 3:35, and 5:45 respectively. The section for 70-100% has a dropdown arrow, suggesting additional options or details, and the section for more than 100% is labeled 'Tuesday Hours' with a tooltip showing 5:17.

The progress bar will update automatically as you log time.

Hovering over the progress bar will show you a calendar of the time you've logged each day this month:
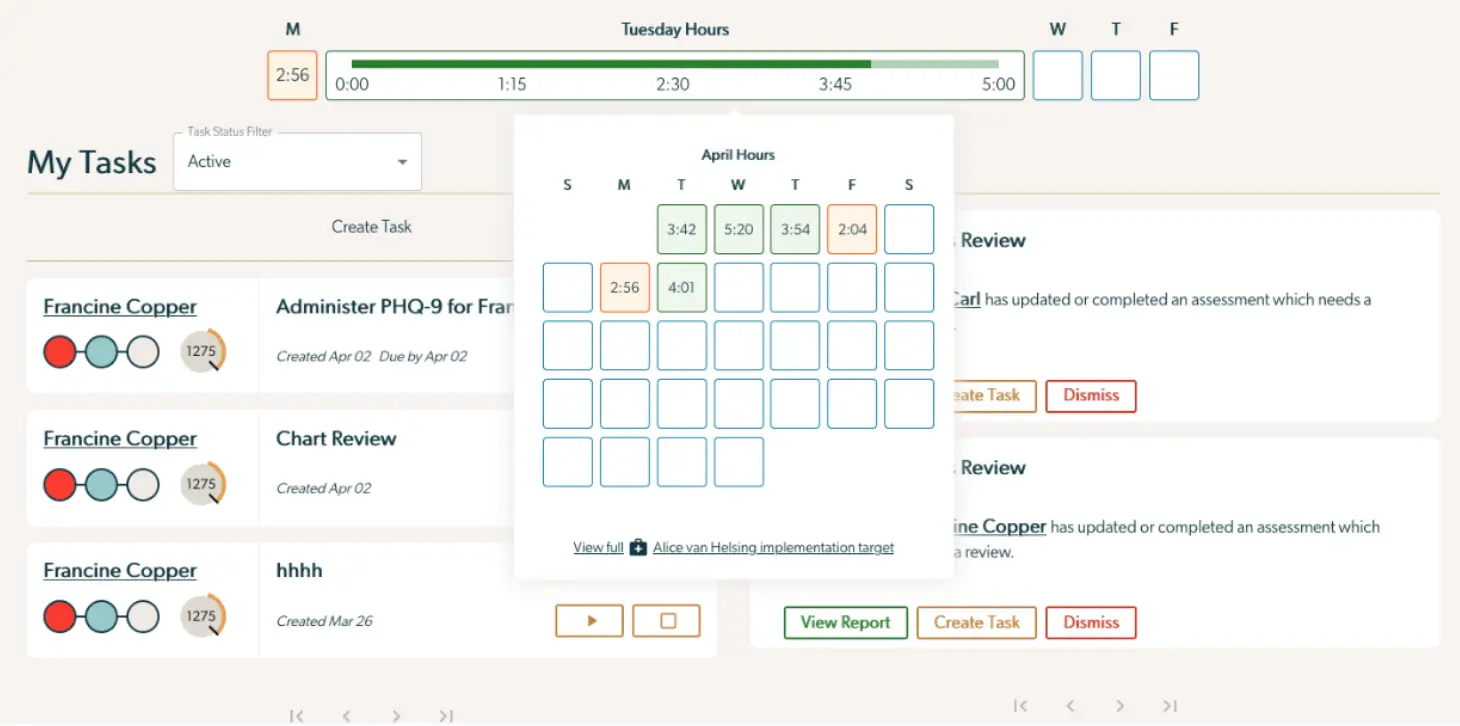
The screenshot displays the Daily Progress Tracker interface within the Mirah Collaborative Care platform, focusing on task management and time tracking. At the top, there is a horizontal bar labeled 'Tuesday Hours' with time intervals from 0:00 to 5:00, indicating the hours worked on a specific day. Below this, a calendar for April is shown, highlighting hours worked on different days with varying colors. The 'My Tasks' section lists tasks assigned to Francine Copper, including 'Administer PHQ-9 for Francine Copper,' 'Chart Review,' and another task labeled 'hhhh.' Each task entry includes a status indicator with colored circles, a numerical identifier '1275,' and creation and due dates. To the right of each task, there are buttons for 'Create Task' and 'Dismiss,' allowing users to manage tasks. The interface also includes a 'Task Status Filter' dropdown set to 'Active' and a 'Create Task' button for adding new tasks. Navigation arrows at the bottom allow users to move between pages of tasks.

Days with no logged time for any reason are shown blank. Days with any amount of time logged are highlighted as shown in the table above. On the page for your billed minutes implementation target (linked at the bottom of the tooltip, or accessible from the "Implementation Targets" menu item) you can see a full calendar of the entire history of your implementation target:
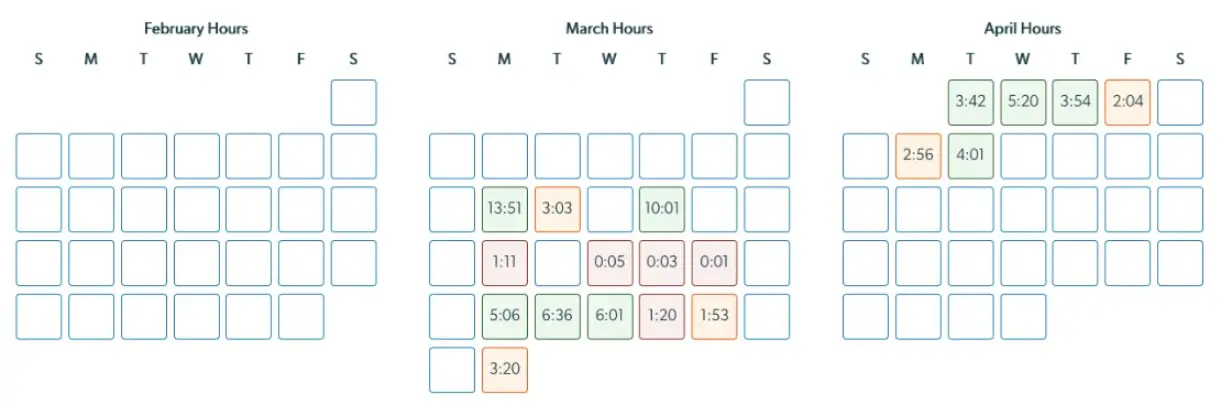
The screenshot displays a calendar view for tracking daily progress hours over three months: February, March, and April. Each month is labeled at the top of its respective section, with 'February Hours', 'March Hours', and 'April Hours'. Days of the week are abbreviated as S, M, T, W, T, F, S, representing Sunday through Saturday. Each day is represented by a square, some of which contain numerical values indicating hours logged for that day. The squares are color-coded, with green, orange, and red indicating different levels of progress or activity. This visual representation helps users quickly assess their daily progress and collaborative care tasks over the specified months.