Clinical Decision Support (CDS)
Clinical Decision Support is a feature that must be turned on by Mirah Support/Customer Success. The following information will only apply if this feature has been enabled for your organization.
CDS Inbox
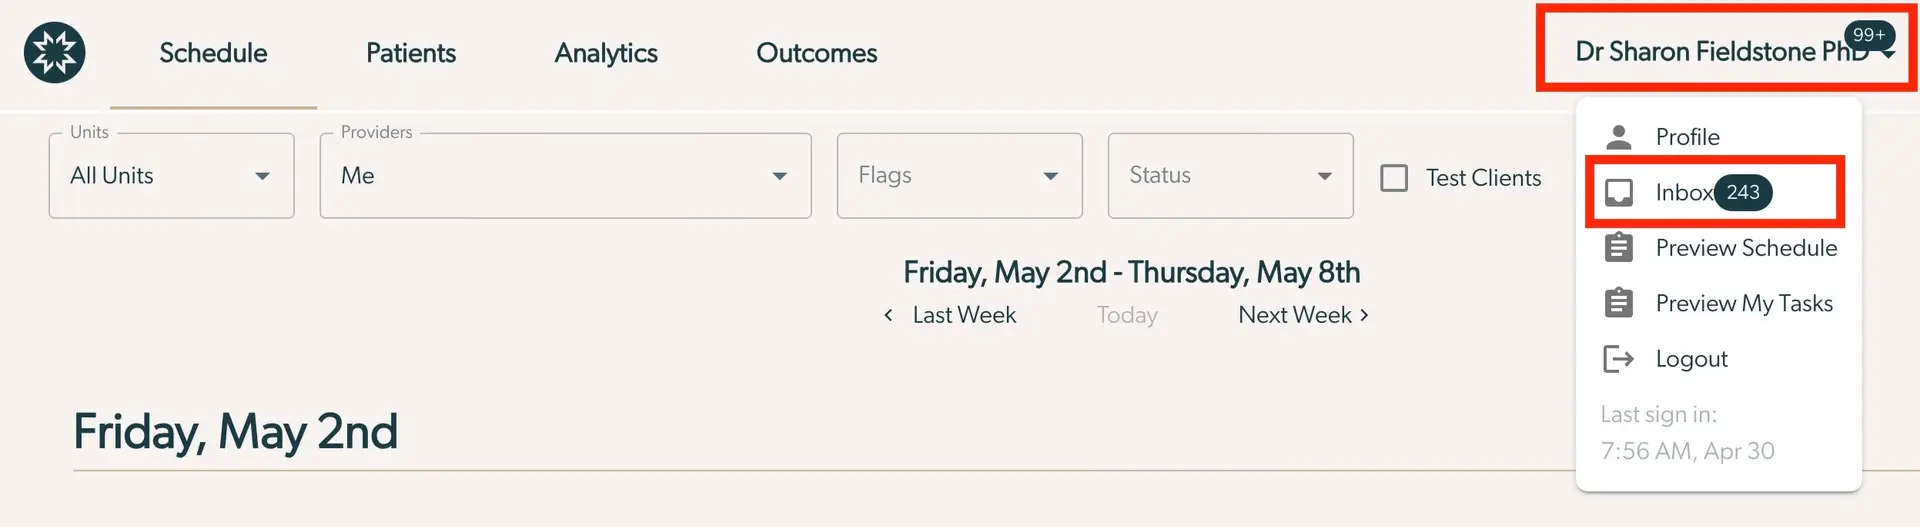
All users in the institute will have an inbox which appears underneath their name on the top right of the screen in Mirah. The Blue circle with a white number in it indicates the number of active alerts for patients who are associated with the provider.
Click on the user name, then on Inbox to access the CDS tool.
CDS Tool
Users will be able to view a list of all active alerts for their patients on the left hand side of the screen. Click on the title of the workflow for any item on the list to view the details of the alert.
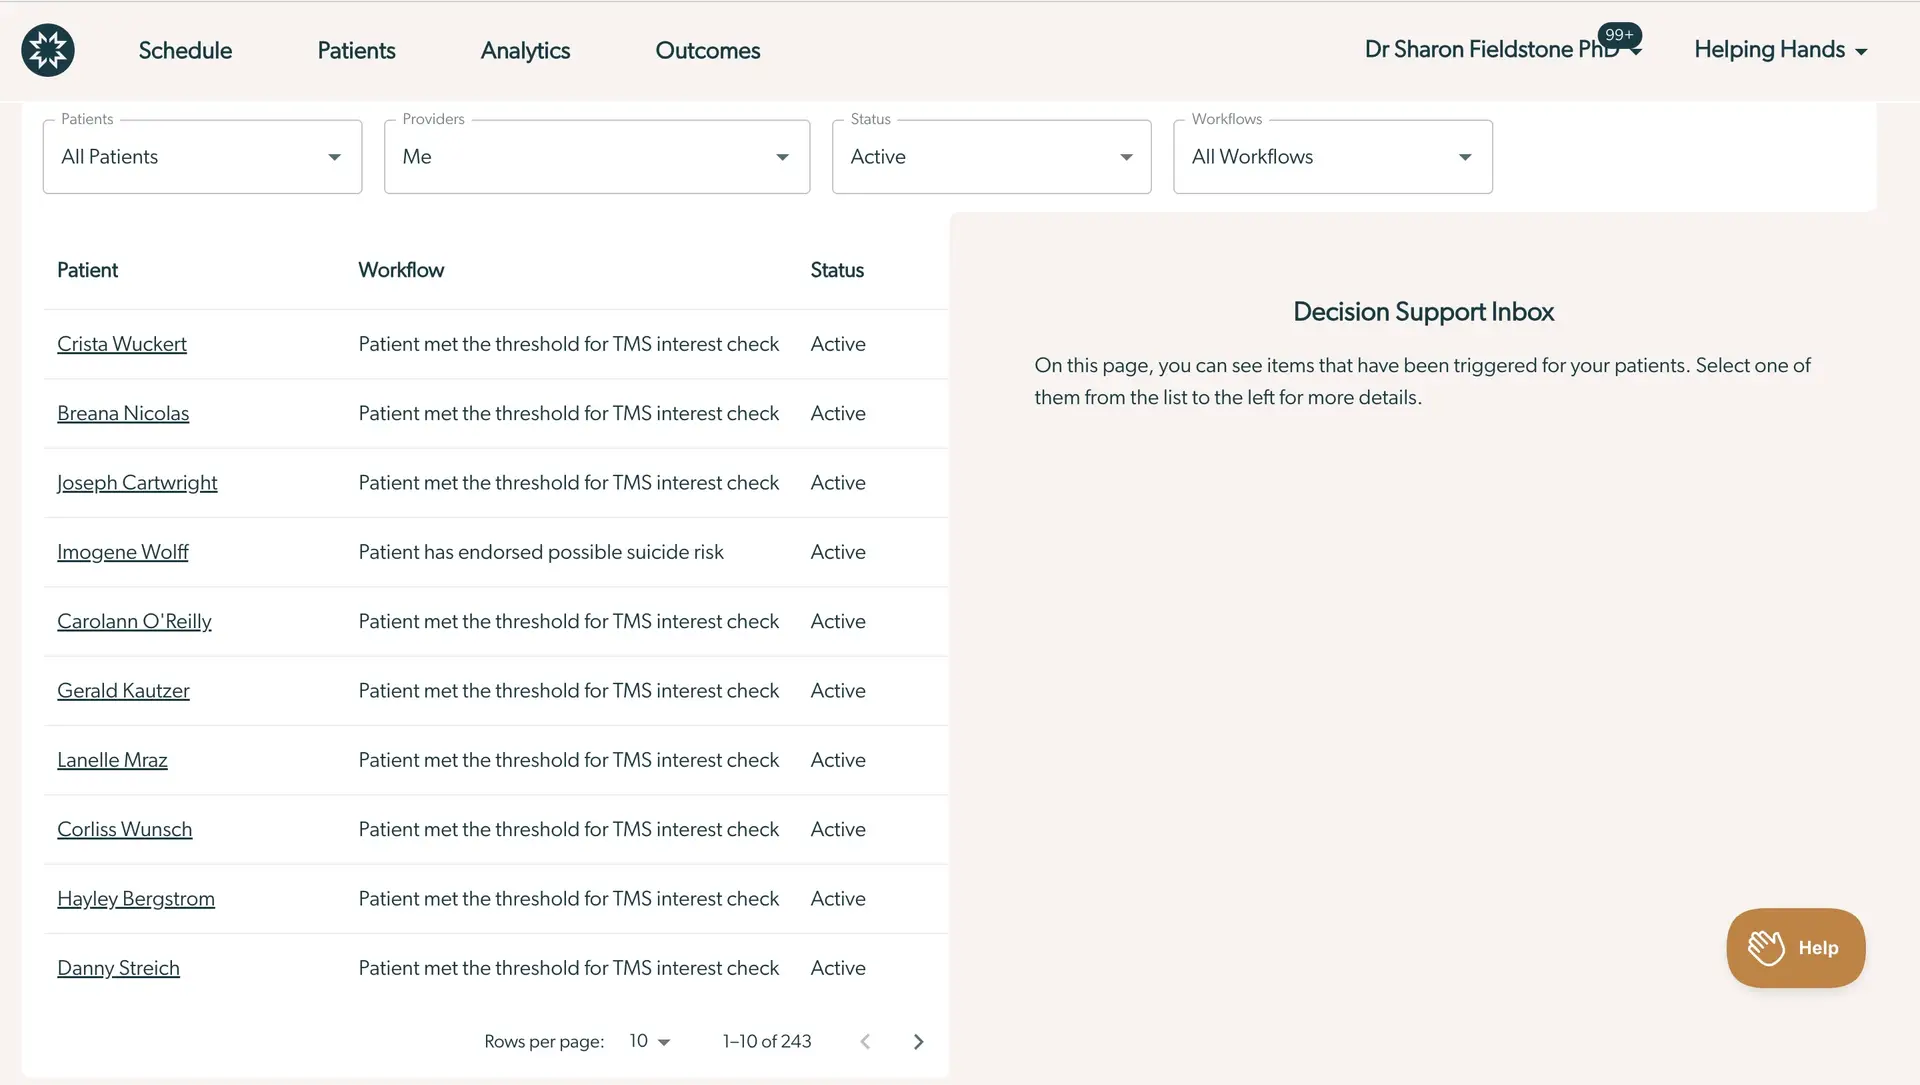
The right hand side of the screen will then display the details about the specific alert including the specific patient response that triggered the alert as well as the date that the alert was triggered.
The blue box contains instructions for users with regards to next steps to manage the alert. These instructions may be customized by organization to provide more specific prompts with regards to the process that should be completed.
Once the designated tasks/processes have been completed, the user can click on the Completed button at the bottom (in this case, completed risk assessment) to mark this alert as complete and it will be changed from an active alert to a completed alert.
Email notifications for CDS Tool
When the CDS tool is enabled, users will receive an email message any time that an alert is triggered for one of their patients. The email message will not indicate any specific patient identifying information, but will prompt the user to review the results. The View notification link will take the user directly to the CDS tool in the platform.
Note: Clinicians/providers will receive email notifications for initial alert triggers and any subsequent increases in acuity. However, if a patient consistently reports the same acuity level that initially triggered the alert, no further emails will be sent. An email notification will be sent if a patient reports a higher acuity than their initial report.