
Outcomes Framework - Create a Metric

In order to create a new metric, select the "Explore & Create New Metrics" from the top right of the Outcomes Dashboard.

The screenshot displays a user interface for creating a metric within the Outcomes Framework of Mirah Collaborative Care's Reporting & Analytics feature. It includes fields for selecting a 'Start Month' and 'End Month' with calendar icons for date selection. The 'Entities' field allows for selection from a dropdown, currently showing 'CoCM' with an option to remove it. A 'Search' field is present for additional filtering. A button labeled 'Show 0 Filters' is located to the right, allowing users to view applied filters. The 'Clear Filters' option is available to reset selections. A prominent button labeled 'Explore & Create New Metrics' is highlighted in orange on the far right, guiding users to initiate the creation of new metrics.

You will then have the option to either start from scratch with a blank metric, or use one of Mirah’s existing templates:
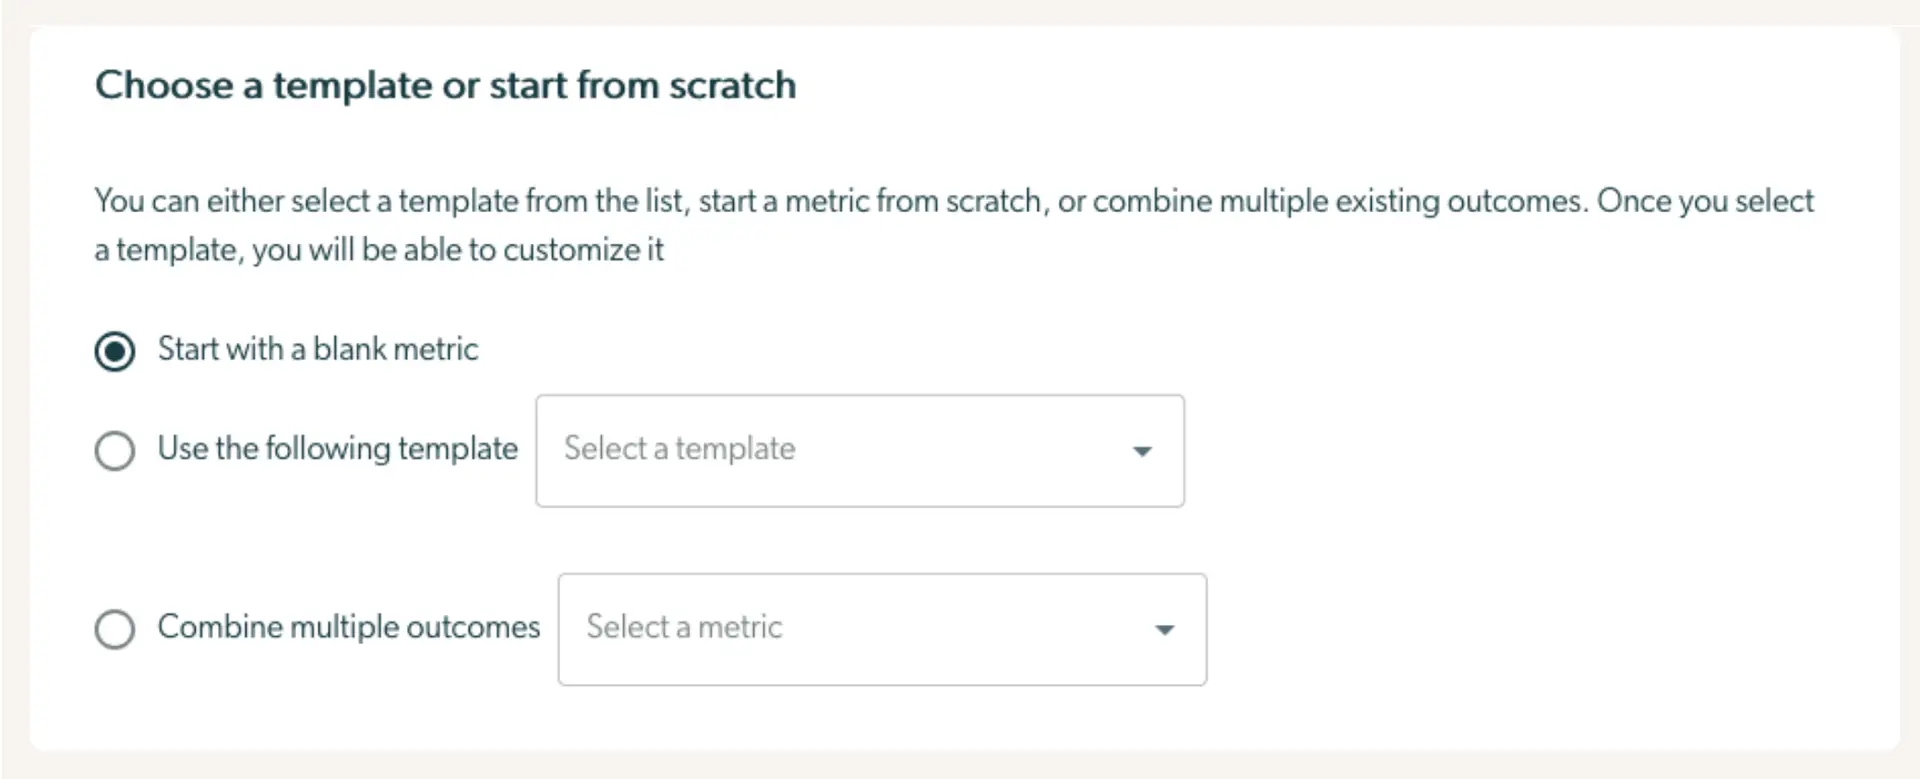
The screenshot displays a section of the Mirah Collaborative Care interface where users can create a new metric within the Outcomes Framework. The user is prompted to choose between starting with a blank metric, using a predefined template, or combining multiple existing outcomes. The first option, 'Start with a blank metric,' is selected by default. Below this, there are two dropdown menus: 'Use the following template' and 'Combine multiple outcomes,' each accompanied by a placeholder text 'Select a template' and 'Select a metric,' respectively. These options allow users to customize their metrics based on existing templates or outcomes.

Starting with a template​

If you start with a predefined template, statistics will immediately be available on the right hand side.

You may choose to change the metric before either downloading the data or saving the metric for continued monitoring.

Creating a metric from scratch​

If you decide to create a metric from scratch, you will have to enter several key pieces of information before any statistics are visible:

  • You must select the mode of metrics between single-scale metric and multi-scale metric.
  • You must select one or more scales, for example the PHQ-9.
  • You must select whether you are creating an Effectiveness or Efficiency Metric. If you are unsure which makes most sense, you should read Types of Metrics.
  • For a Effectiveness Metrics you must select:
  • For a Efficiency Metrics you must select:
  • You must select whether the metric should be displayed as a line chart or a column chart. Line charts are best used when you want to see how a single value changes over time, while column charts are best used to compare distinct values.

Once you have selected these details, statistics will appear on the right hand side of the page in the "Statistics" section which can be understood here.

See how to download this data for analysis here.

Creating a Combined Metric​

To create a combined metric, enter the following information:

First, select the metrics you want to combine from the metric search:

The screenshot shows a section of the Mirah Collaborative Care interface where users can create a metric by combining multiple outcomes. It features a radio button labeled 'Combine multiple outcomes' on the left, indicating the selection of this option. To the right, there is a dropdown menu labeled 'Select a metric' containing two selected metrics: 'PHQ9' and 'GAD7', each with an 'X' button next to them for removal. The dropdown arrow on the far right allows users to add more metrics.

Then, give the metric a name and select a color for each individual metric you're combining:
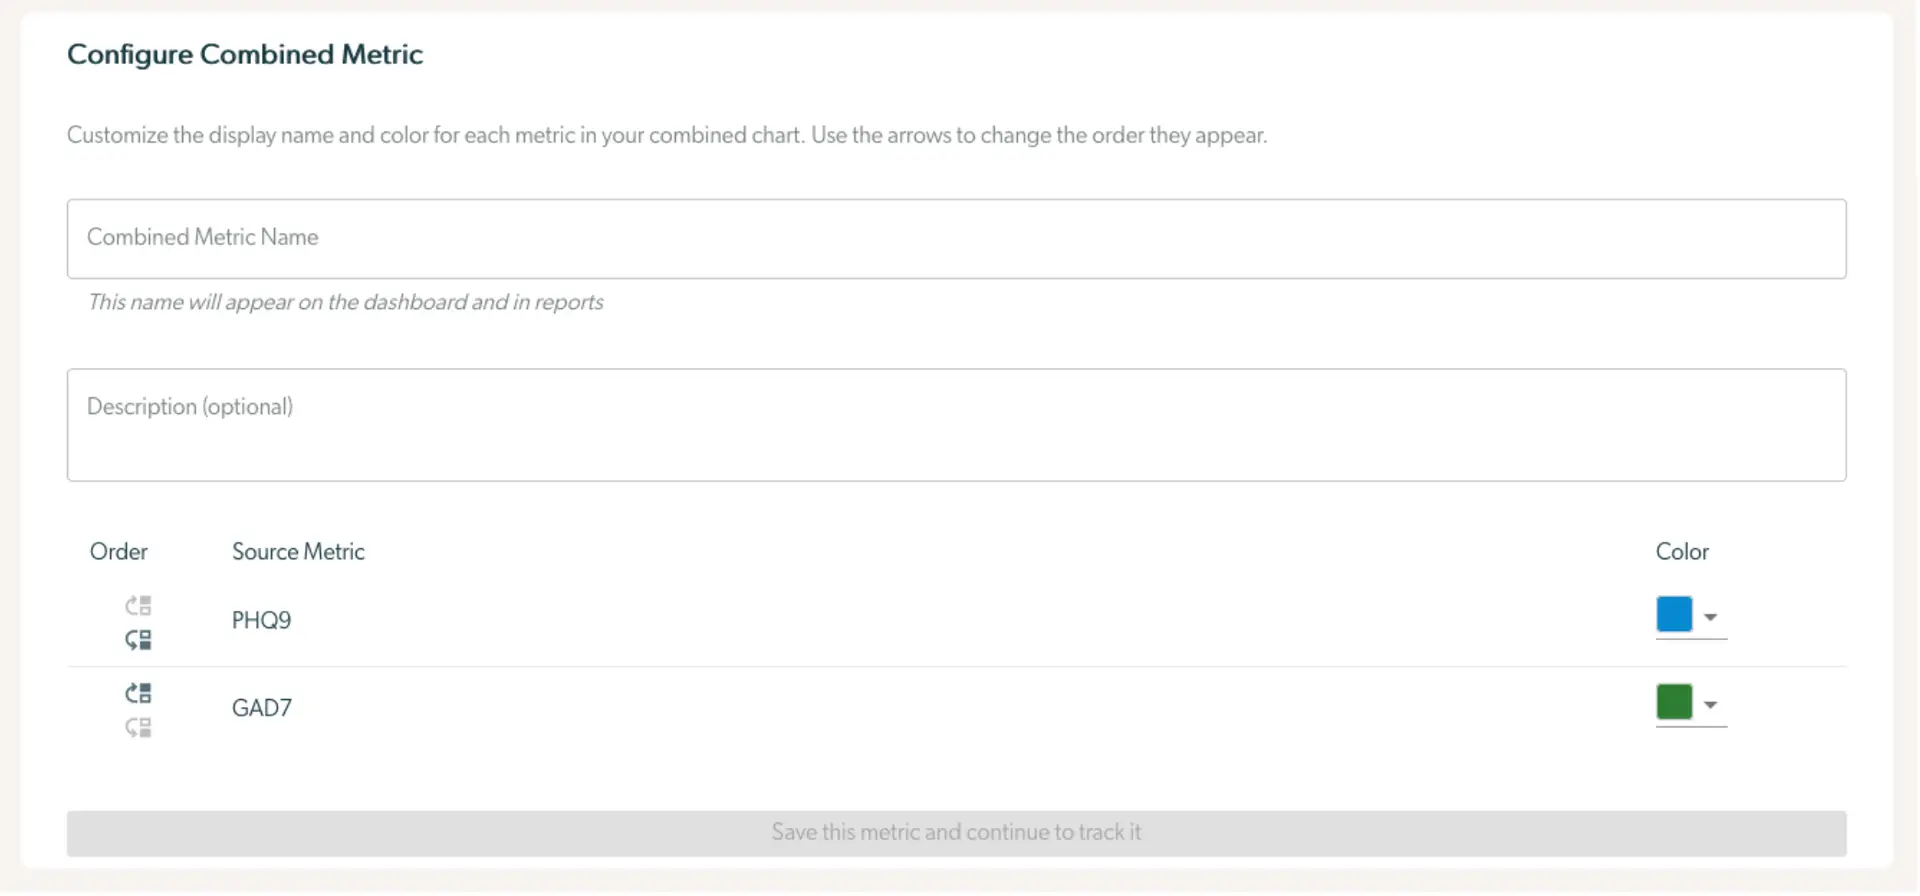
The 'Configure Combined Metric' screen allows users to customize the display name and color for each metric in a combined chart. Users can enter a 'Combined Metric Name' which will appear on the dashboard and in reports, and an optional 'Description'. Below, there is a table listing the order and source metrics, such as 'PHQ9' and 'GAD7', with corresponding color selectors. Users can change the order of metrics using arrows next to each source metric. At the bottom, there is a button labeled 'Save this metric and continue to track it' to save the configuration.

Saving metric for continued monitoring​

If you want to continue to monitor the metric, you can press "Save this metric and continue to track it" at the bottom of the "Configure Your Metric" section.

The screenshot displays a button labeled 'Save this metric and continue to track it'. This button is designed to allow users to save the current metric they are working on within the Outcomes Framework feature of Mirah Collaborative Care. Once clicked, it enables users to continue tracking the saved metric, facilitating ongoing reporting and analytics. The button is centrally located and is styled in a brown color, making it visually distinct for easy identification and interaction.

You will be asked to give the metric a name. Once you save it, it will become available on the Metric Dashboard.
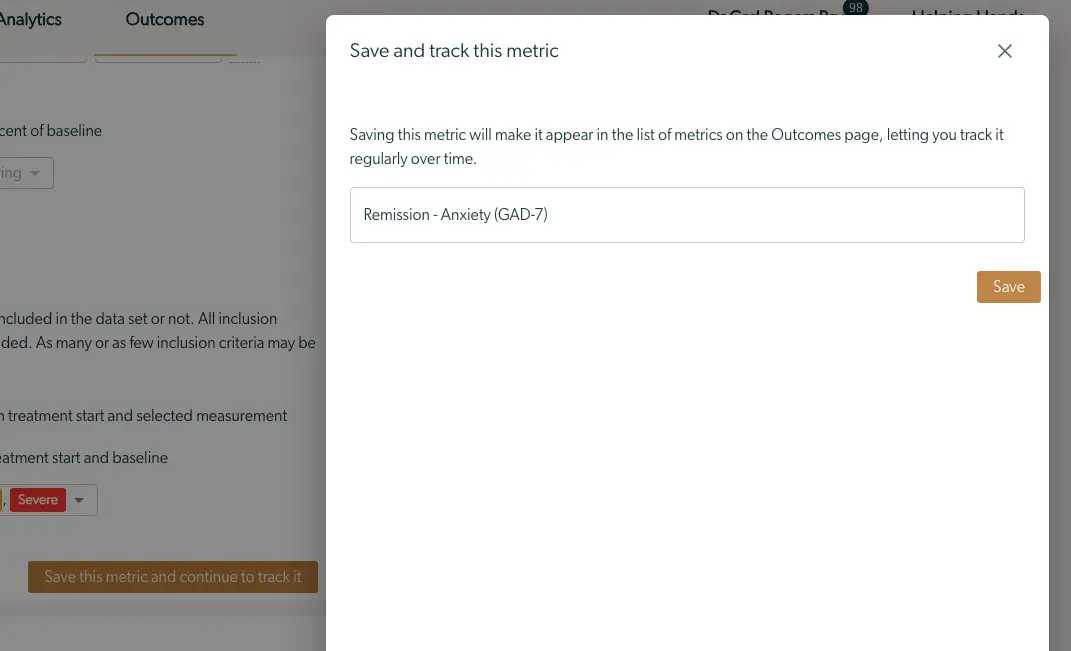
The screenshot displays a modal window titled 'Save and track this metric' within the Mirah Collaborative Care platform. The purpose of this screen is to allow users to save a specific metric for tracking over time. The text box contains the metric 'Remission - Anxiety (GAD-7)', indicating the focus on tracking anxiety remission using the GAD-7 scale. Below the text box, there is a description explaining that saving this metric will make it appear in the list of metrics on the Outcomes page, enabling regular tracking. In the bottom right corner, there is a 'Save' button, which users can click to confirm and save the metric for tracking.