Outcomes Framework - Breakdown
The natural next question to ask when constructing a metric is which parts of the organization are performing strongly and which parts may need further support.
Scroll down to the "Show a breakdown" section. This shows each patient who matches the "Treated" and "In time period" (if applicable) criteria. By making a selection in the "Breakdown by provider, organization..." dropdown, you can see the final Effectiveness or Efficiency Metric broken down by category such as "Provider" or "Treatment Track". It will only display data within the Entity and Dates selected above.
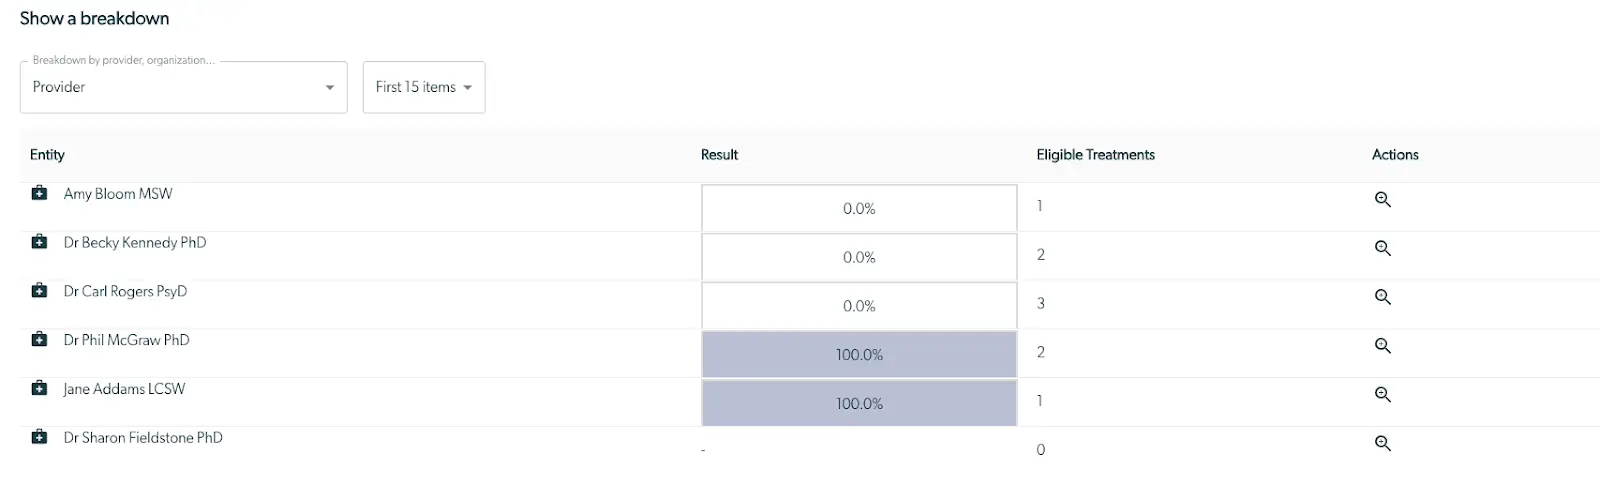
Here is a description of what each field is:
- Entity: Options within the breakdown type selected. For example, if "Provider" is selected in the dropdown, all Providers with patients in the metric will appear here.
- Result: Effectiveness or Efficiency Metric used in the "Statistics" for only patients in that breakdown Entity.
- Eligible Treatment Episodes: Number of Treatment Episodes in the "Included" category of the "Statistics" within that breakdown "Entity".
- Actions: Allows you to Zoom in to only see the "Included" patients of the "Statistics" in that breakdown "Entity". By selecting this, you will change the "Entity" you are viewing and therefore Zoom in the "Statistics" for that particular "Entity". Do not worry, you are not permanently editing the metric.
When you Zoom in on a particular "Entity" by pressing the magnifying glass, you will see a list of Treatment Episodes as pictured below.

Here is a description of what each field is:
- Treatment Episode Start Date: First day of Treatment Episode
- If your EMR provided Mirah with Treatment Episode information, it uses the date from your EMR. If not, it is the date of the first appointment. See more in the FAQ.
- Patient: Name of patient associated with Treatment Episode
- You can click the name to see the patient page
- Baseline: Measure score baseline & categorized symptom level
- Result: Measure score & categorized symptom level of measurement used in Statistic
- Days between Treatment Start and Measurement: Number of days between start date of Treatment Episode to date of measurement used in Statistic
- Included?: Whether the patient meets the Inclusion Criteria
- Successful?: Whether the patient meets the Success Criteria
The number of patients shown on the page can be adjusted by selecting the ‘First 15 items’ dropdown.
By looking at individual results, you can gain confidence in the Statistics. The number of patients listed here matches the number in In Time Period of the Statistics.
Note that the Outcomes Framework is designed to create a population-level metric. There will always be individual Treatment Episode that feel ‘wrong’. For example, a patient who got better the week after the measurement point, or a patient who had an acute crisis right after the last time they got measured might not match the rest. It’s impossible to factor those individual cases into a metric like this, so instead concentrate on the broad trends.
To create your own reports, learn how to download your date here.
Organizations interested in considering clinical outcome data as a basis for employee evaluation are encouraged to take a balanced approach, understanding both the risks and benefits of applying the data in this way.