
Outcomes Framework - Download Results

When you’ve spent sufficient time playing with the settings on the metric and you understand the breakdowns, you can download an Excel spreadsheet with all the data based on your configurations.

Please note:​

Some of the analysis done by the Mirah system is too complicated to easily represent in Microsoft Excel downloads. If you select an option which is not supported, the Download this data in Excel format will be disabled. Currently, we do not support downloads for Efficiency metrics, only for Effectiveness metrics.

There are two ways of downloading data.​

1). On either the Create or Edit Metric screen or Metric Details page, press Download this data in Excel format in the Statistics section.
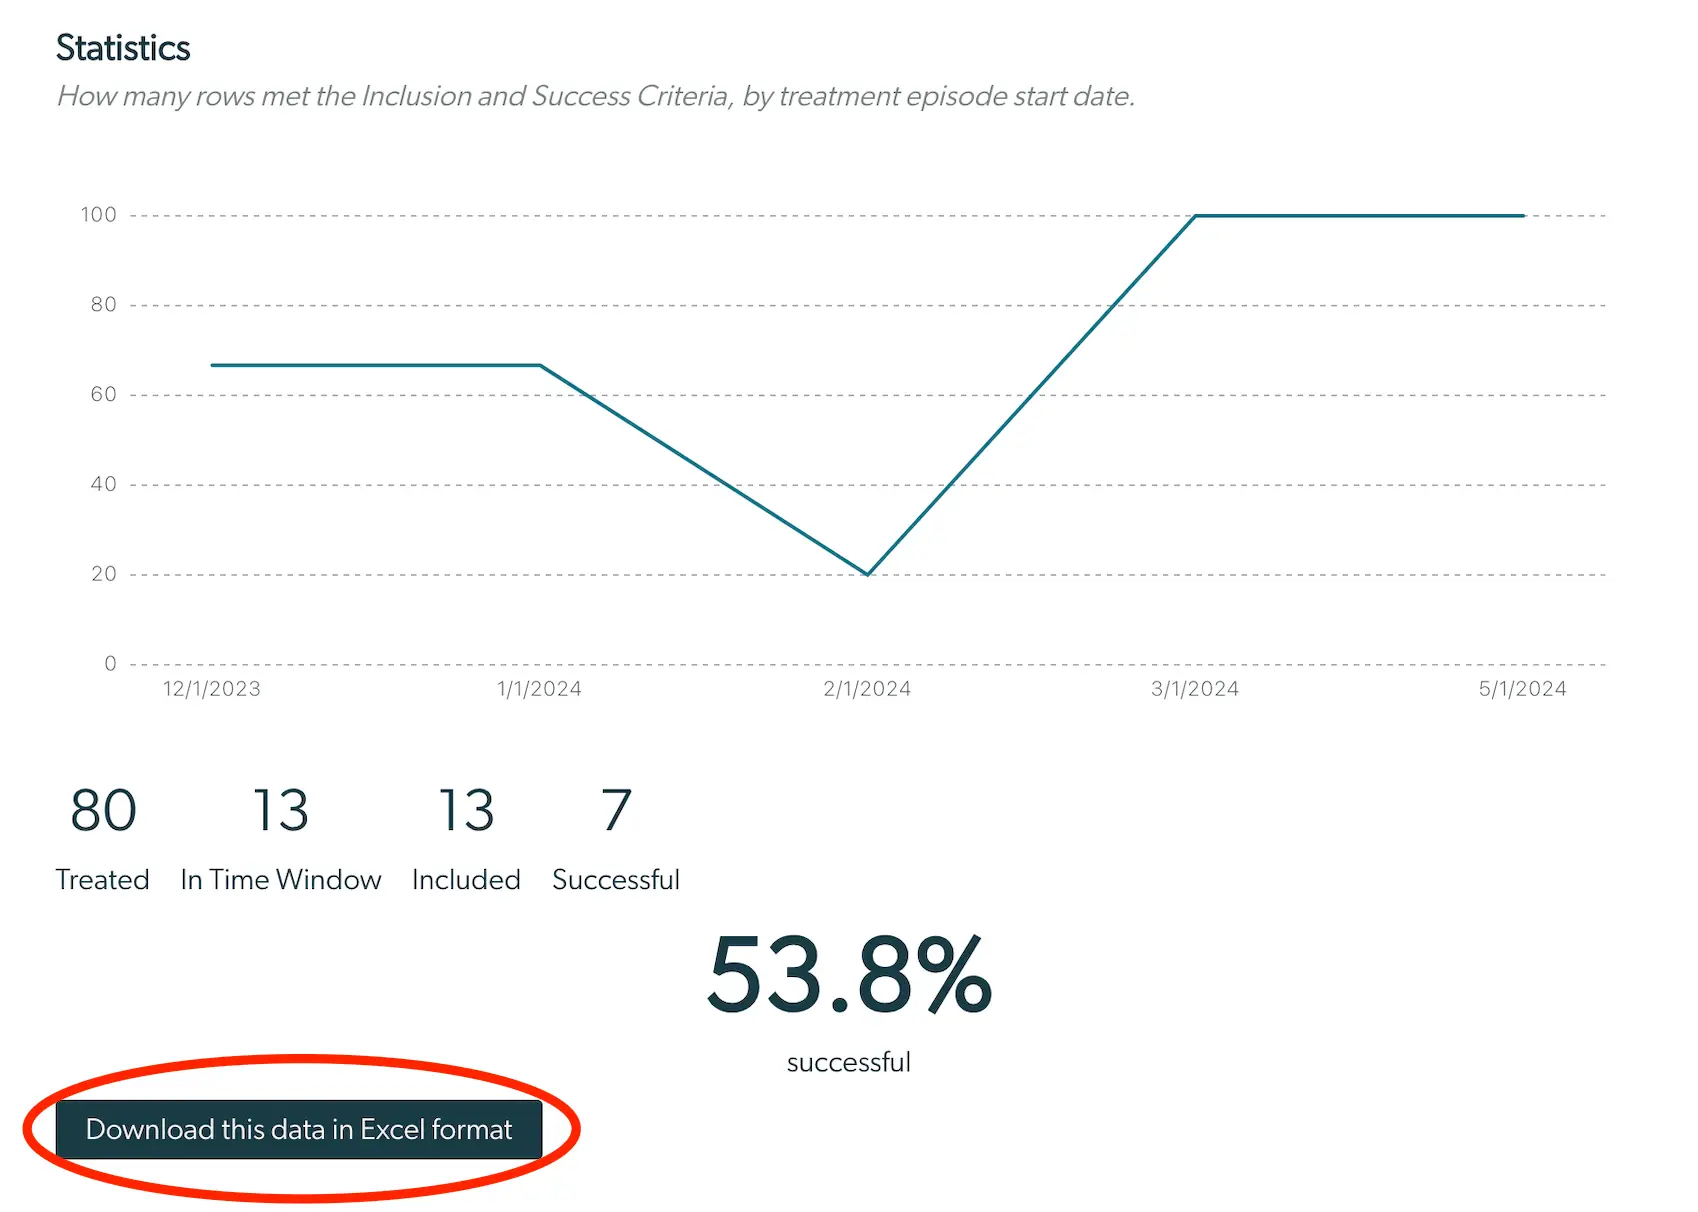
The screenshot displays a statistics page from the Mirah Measurement-Based Care platform, specifically focusing on the Outcomes Framework under the Reporting & Analytics feature. The page provides a line graph illustrating the number of rows that met the Inclusion and Success Criteria by treatment episode start date, with dates ranging from 12/1/2023 to 5/1/2024 on the x-axis and a scale from 0 to 100 on the y-axis. Below the graph, there are numerical statistics: 80 Treated, 13 In Time Window, 13 Included, and 7 Successful, with a large percentage figure of 53.8% labeled as successful. At the bottom left corner, there is a button labeled 'Download this data in Excel format,' which allows users to export the displayed data.

2). On the Metric Dashboard, click the download icon pictured below.
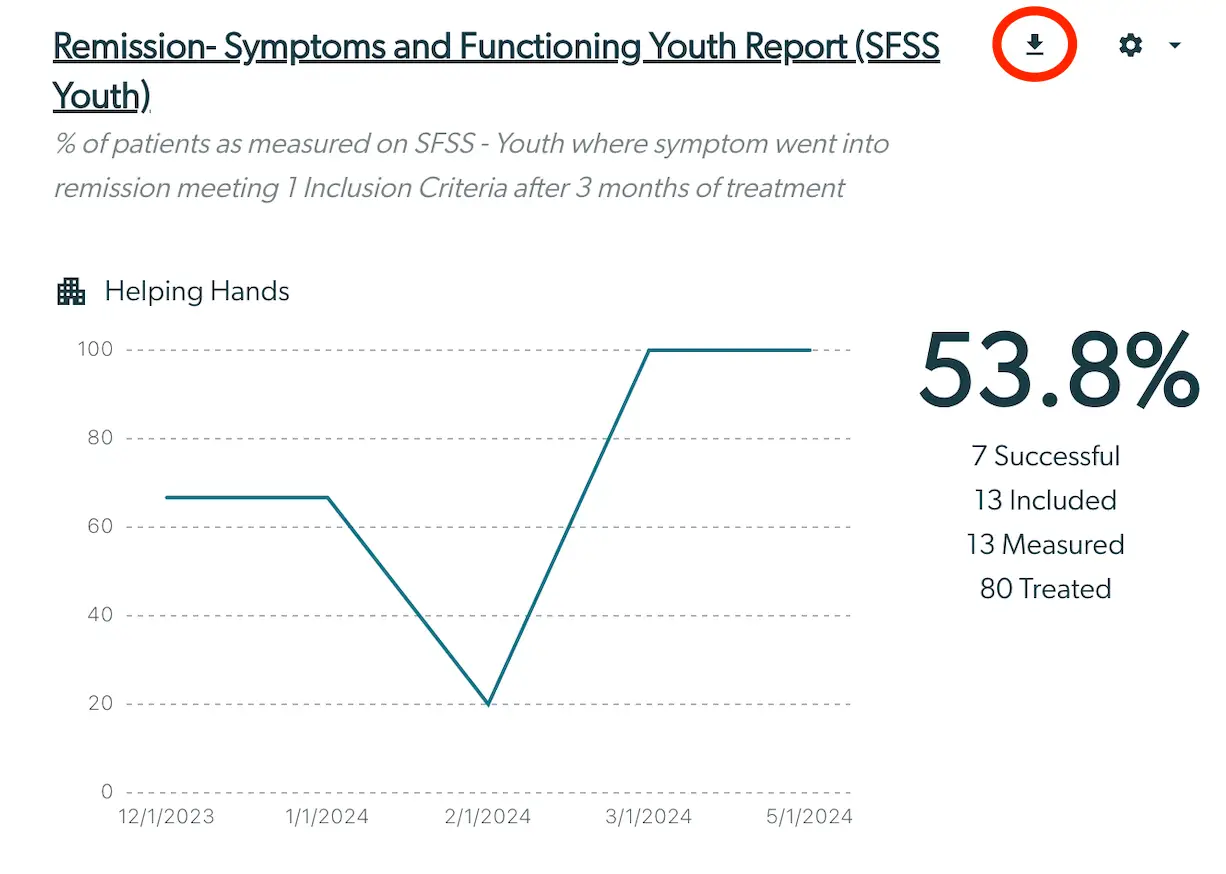
The screenshot displays the 'Remission- Symptoms and Functioning Youth Report (SFSS Youth)' which provides insights into the percentage of patients whose symptoms went into remission after meeting one inclusion criterion following three months of treatment. The report includes a line graph titled 'Helping Hands' that shows data points over time, specifically from December 1, 2023, to May 1, 2024. The graph illustrates the percentage of patients, with values ranging from 0 to 100. On the right side, the report highlights a key metric of 53.8%, indicating the success rate, along with detailed statistics: 7 Successful, 13 Included, 13 Measured, and 80 Treated. At the top right corner, there is a download button encircled in red, allowing users to download the report, and a settings icon next to it for additional configurations.

Confirming Download​

Once you press the respective download button, it will be asked to give the spreadsheet a name.

The screenshot displays a modal window titled 'Download Data' which is part of the Reporting & Analytics feature in Mirah Measurement-Based Care. The purpose of this screen is to allow users to download metrics as an Excel file. It contains a text field labeled 'Give the file a name' where users can input a name for the file they wish to download. Below the text field, there is a button labeled 'Begin export' which is currently disabled, indicating that the user must enter a file name before proceeding. The modal can be closed using the 'X' button located at the top right corner.

Begin export​

The spreadsheet download doesn’t contain any PHI, so it can be freely shared via email or other methods of communication. Customers often use this download to share the results with executive leadership and those who do not have access to the Mirah tool. See photo below of the dashboard tab in the Excel download.
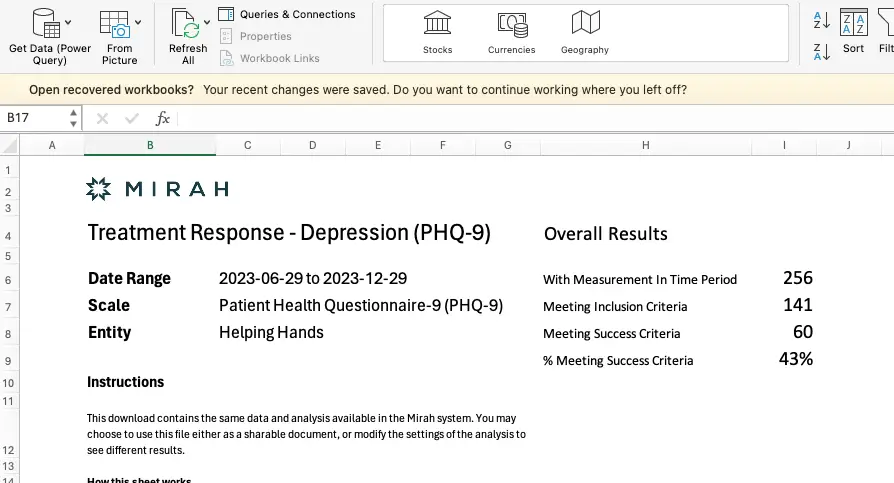
The screenshot displays a spreadsheet from Mirah Measurement-Based Care, specifically focusing on the 'Treatment Response - Depression (PHQ-9)' report. The top section includes the Mirah logo and the title of the report. Below the title, the report details are provided, including the date range from 2023-06-29 to 2023-12-29, the scale used which is the Patient Health Questionnaire-9 (PHQ-9), and the entity involved, Helping Hands. The right side of the screen shows the 'Overall Results' section with metrics such as 'With Measurement In Time Period' showing 256, 'Meeting Inclusion Criteria' showing 141, 'Meeting Success Criteria' showing 60, and '% Meeting Success Criteria' showing 43%. Instructions are provided below these details, explaining that the download contains the same data and analysis available in the Mirah system, and users can choose to share or modify the settings for different results. The spreadsheet interface includes options for data retrieval and refresh, located at the top left, and various workbook functionalities are accessible through the toolbar.

More instructions on how to use the Excel export are included in the spreadsheet itself.

If you want to continue to monitor the metric, make sure to save it. Instructions on how to do this are at the bottom of the pages for Editing a Metric or Creating a Metric, depending on your circumstance.