
Outcomes Framework - Metric Dashboard

Once a metric has been saved, it is available on the Metrics Dashboard.

You can go directly to this page with this URL: .mirah.com/app/outcomes
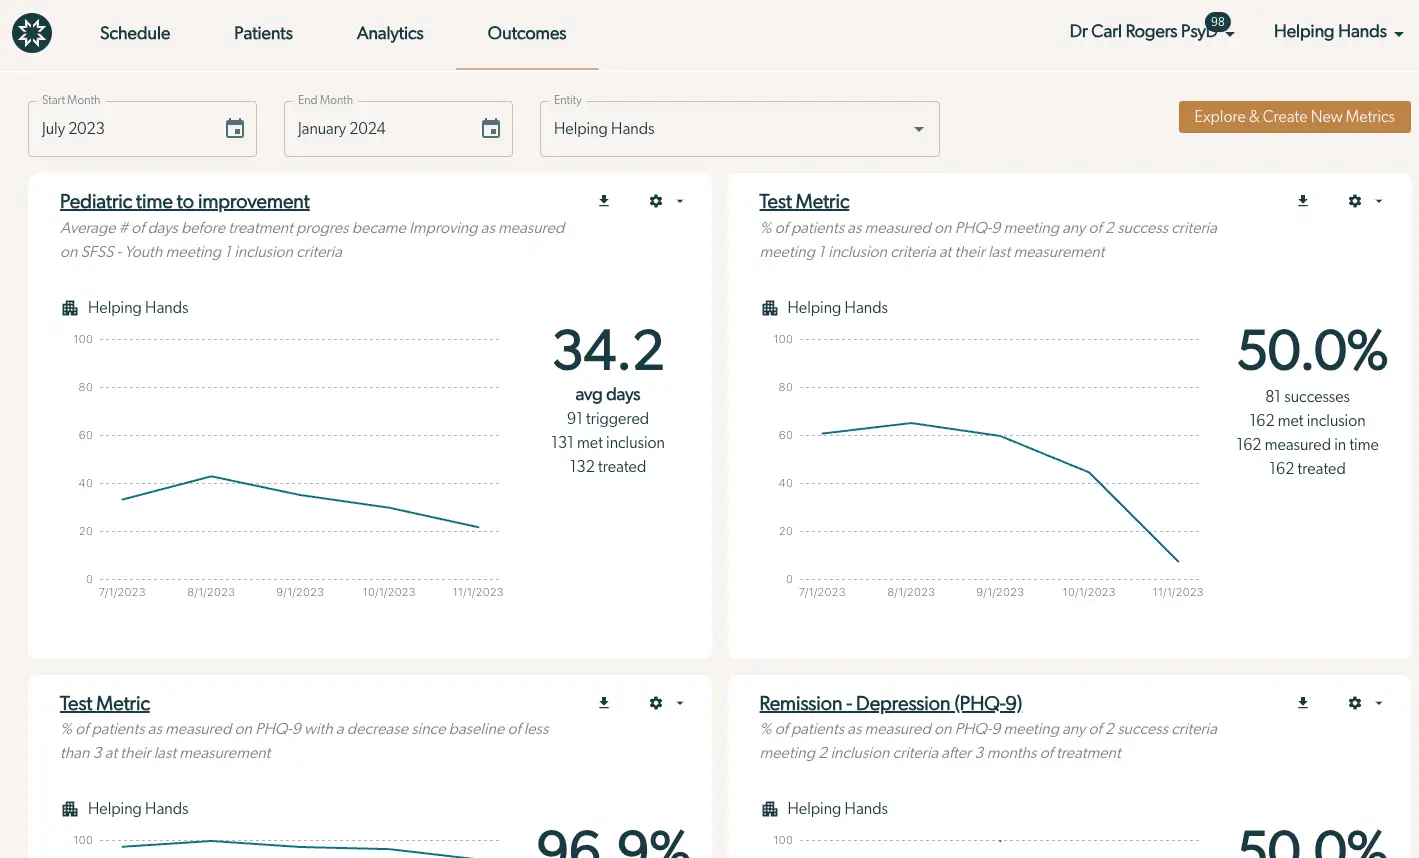
The screenshot displays the Outcomes Framework - Metric Dashboard within the Mirah Collaborative Care platform, specifically under the Reporting & Analytics feature. The dashboard is designed to provide insights into various metrics related to patient care. At the top, there is a navigation bar with options for Schedule, Patients, Analytics, and Outcomes. Below, there are date selectors for Start Month and End Month, set to July 2023 and January 2024, respectively, and an Entity dropdown set to Helping Hands. The main content area is divided into four sections, each representing a different metric. The first section, 'Pediatric time to improvement,' shows a line graph and statistics indicating an average of 34.2 days for treatment progress, with additional details on triggered, met inclusion, and treated cases. The second section, 'Test Metric,' displays a line graph and a 50.0% success rate for patients meeting specific criteria, along with related statistics. The third section, another 'Test Metric,' shows a 96.9% rate for patients with a decrease in PHQ-9 scores. The fourth section, 'Remission - Depression (PHQ-9),' presents a 50.0% remission rate with corresponding data. Each section includes options to download data or adjust settings, located at the top right of each metric box. The 'Explore & Create New Metrics' button is prominently placed on the right side of the screen.

On the dashboard you can select one of several controls to change what data you see:​

  • You may change the cohort of data by changing the Start Month or End Month filter. This applies to the start month of treatment episode, so don’t expect to see data for the current month yet.
  • You may select Entities to focus on.
    • Selecting a different entity will change the visible metrics, but will not affect the data in those metrics, which is controlled by the target set of entities for each metric.
    • Metrics can be related to entities in one of three ways:
      * Items specific to that entity. For example, if you select “Acute Stabilization Unit” in the entity box, you will see metrics that are specified for exactly “Acute Stabilization Unit” - without any additional entities selected.
      * Sub-items that contribute to that entity. For example, if you select “Acute Stabilization Unit”, you will see items that are configured to look at data for “Acute Stabilization Unit and Dr Smith” or “Acute Stabilization Unit and Adult CBT Bootcamp”.
      * Rollup items that this entity contributes to. For example, if you select “Acute Stabilization Unit”, you will see items that include the ASU, like a metric for Sunshine Hospital
    • Learn more about Entities here including the logic of how data/metrics are related to an Entity.

In order to change which of these options you see, there is now a button on the metrics dashboard:

The screenshot displays a button labeled 'Show 1 Filter' which is part of the Outcomes Framework - Metric Dashboard in the Mirah Collaborative Care platform. This button is used to reveal the currently applied filter on the dashboard, allowing users to view or modify the filter settings to refine the data displayed in the reporting and analytics section. The button is centrally located and visually distinct with a filter icon preceding the text.

Clicking this exposes the following options:
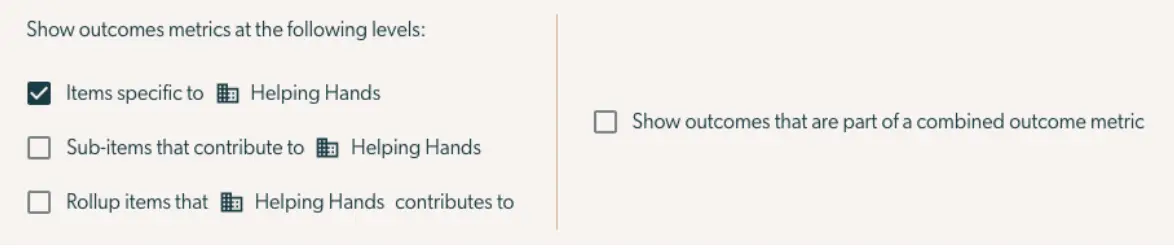
The screenshot displays a section of the Outcomes Framework - Metric Dashboard within the Mirah Collaborative Care platform, specifically focusing on reporting and analytics. It presents options for displaying outcome metrics at different levels. There are checkboxes for 'Items specific to Helping Hands', 'Sub-items that contribute to Helping Hands', and 'Rollup items that Helping Hands contributes to'. The first option is checked, indicating it is selected. On the right side, there is an additional checkbox labeled 'Show outcomes that are part of a combined outcome metric', which is currently unchecked. These options allow users to customize the level of detail in the outcome metrics they wish to view.

On the left you can change how the entity selector works to expand the set of metrics shown on the dashboard. On the right you can choose to see metrics that are part of a combined metric. By default these are hidden, since their information is visible in the combined metric.

Additional Information​

If you would like to see more detail on a specific metric, click the name of the metric to view more details. See here for instructions on how to read the Metric Details.

If you want to edit a metric, see here for instructions.