Outcomes Framework - Statistics
The Statistic will look slightly different if it is showing an Effectiveness or Efficiency Metric. The general layout is the same, the statistic numbers have different meanings. This will explain those differences and how to read each one.
Note that if the date range is less than 180 days, the X-Axis will be grouped by weeks. If the date range is greater than 180 days, the X-Axis will be grouped by months.
Effectiveness Metric Statistics
Whenever you create an Effectiveness Metric, the system will show you statistics of the patients in the system and whether they will be displayed in the result. In order to be in the final number, the patient needs to be part of the Entity, measured on the Scale, within the Example Dates, in the Time Period, meet all the Inclusion Criteria, and meet at least one of the Success Criteria.
This is what the Statistics look like on the Metric Dashboard.
See here for how to access and use the Metric Dashboard.
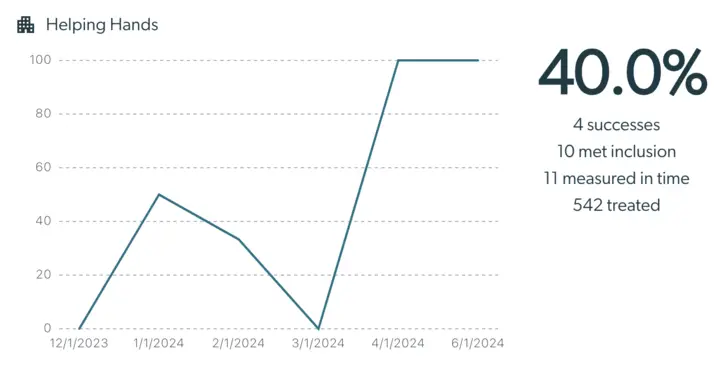
This is what the Statistics look like on the Metric Details page.
See here for how to access and use the Metric Details page.
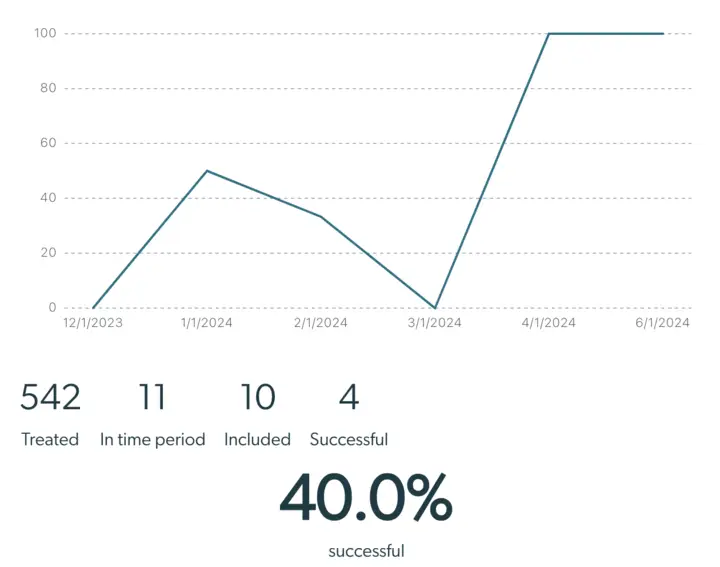
These graphs display the same information. The only difference is the placement of the numbers.
This graph helps break down which patients will be displayed in the analysis, and which will not. Please note that the tool does not calculate the power of results based on the sample size, so please keep that in mind when drawing conclusions.
- The Treated number indicates the number of patients who began care within the specified Dates, fall within the specified Entity, and have been measured two or more times on the selected Scale.
- The In time period number further specifies from the Treated patients those who had a valid measurement during the specified time period. By default the Treatment Episode Response - Depression (PHQ-9) template measures success after the 3rd month of Treatment Episode, so in that example, the Treated patients with a valid PHQ-9 measurement in the 3rd month of Treatment Episode count in the In time period number. Details on how to customize Time Period can be found here.
- The Included number counts the number of patients who were Treated and In time period who meet all the Inclusion Criteria. This filters out patients who were of the wrong severity to start or did not establish a viable baseline. Details on how to change Inclusion Criteria can be found here.
- The Successful number counts the number of patients who were Treated, In time period, Included, AND meet one of the Success Criteria. For the PHQ-9 template, we measure success as Treatment Episode Response, which means an improvement of greater than 5 points. See more on Success Criteria here.
- Finally the large percentage value labeled successful by default displays the percentage of Included patients who are Successful. It is calculated as Successful patients / Included patients. In the Aggregation settings in Configure Your Metrics, this can be changed to the Number (#) of patients. This will be the exact same number as the Successful number.
Efficiency Metric Statistics
Whenever you create an Efficiency Metric, the system will show you statistics of the patients in the system and whether they will be displayed in the result. In order to be displayed, the patient needs to be part of the Entity, measured on the Scale, within the Example Dates, meet all the Inclusion Criteria, and meet at least one of the Triggers.
This is what the Statistics look like on the Metric Dashboard.
See here for how to access and use the Metric Dashboard.
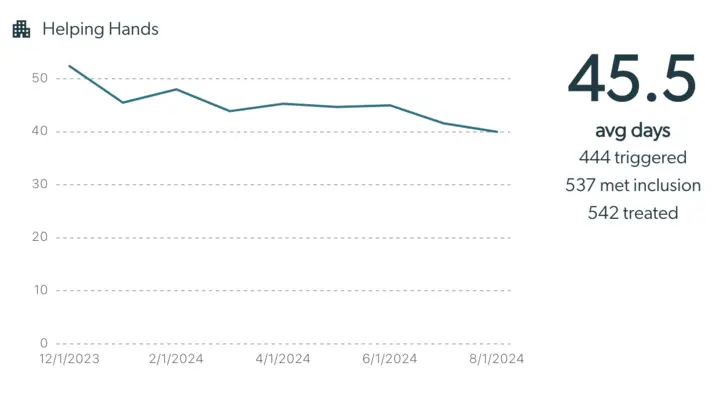
This is what the Statistics look like on the Metric Details page.
See here for how to access and use the Metric Details page.
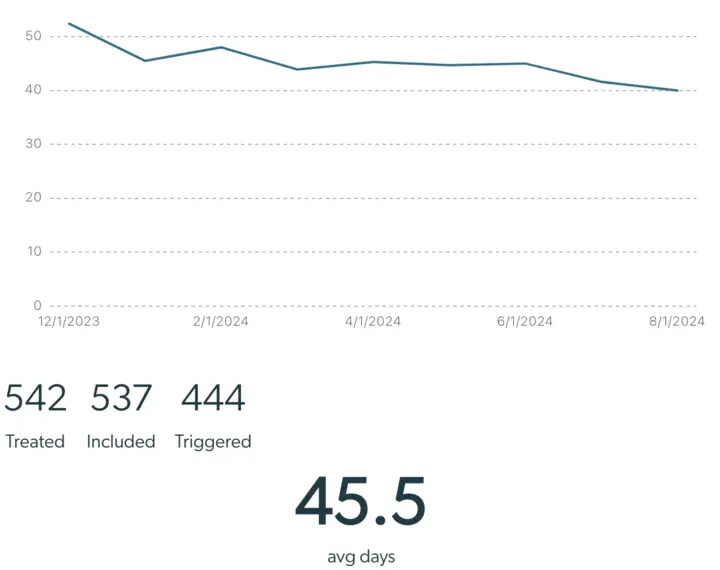
These graphs display the same information. The only difference is the placement of the numbers.
This graph helps break down which patients will be displayed in the analysis, and which will not. Please note that the tool does not calculate the power of results based on the sample size, so please keep that in mind when drawing conclusions.
- The Treated number indicates the number of patients who began care within the specified Dates, fall within the specified Entity, and have been measured two or more times on the selected Scale.
- The Included number counts the number of patients who were Treated and meet all the Inclusion Criteria. This filters out patients who were of the wrong severity to start or did not establish a viable baseline. Details on how to change Inclusion Criteria can be found here.
- The Triggered number counts the number of patients who were Treated, Included, AND meet one of the Trigger Criteria. See more on Trigger Criteria here.
- Finally the large value labeled avg days displays the average number of days it took for Included patients to reach a Trigger Criteria. This is the number that always shows for Efficiency Metrics.
Combined Metric Statistics
Whenever you create a Combined Metric, the system will show you the top-level value statistic for each metric in the combination. This is what combined metric statistics look like on the Metric Dashboard:
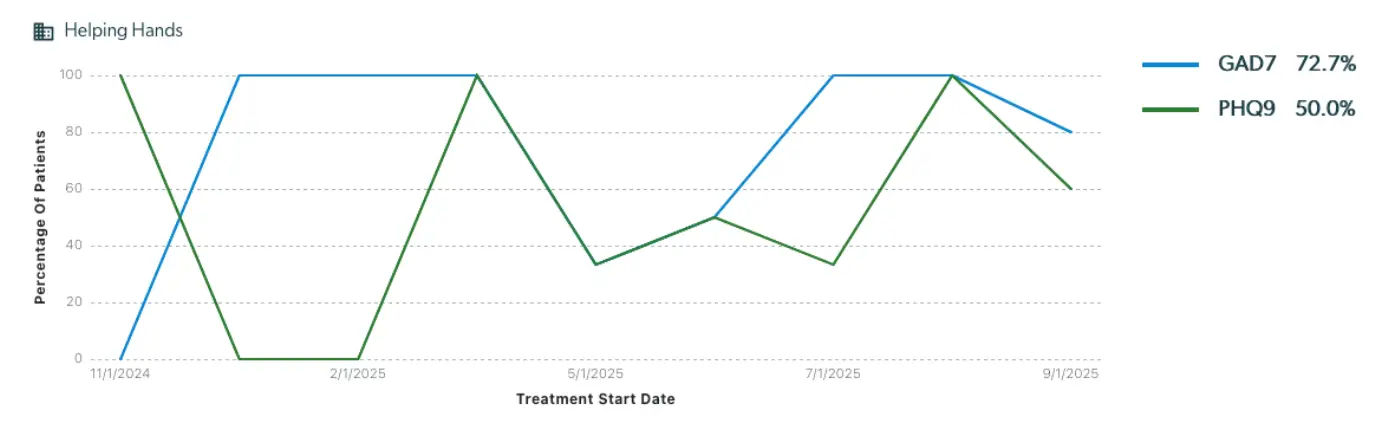
This is what combined metric statistics look like on the Metric Details page:
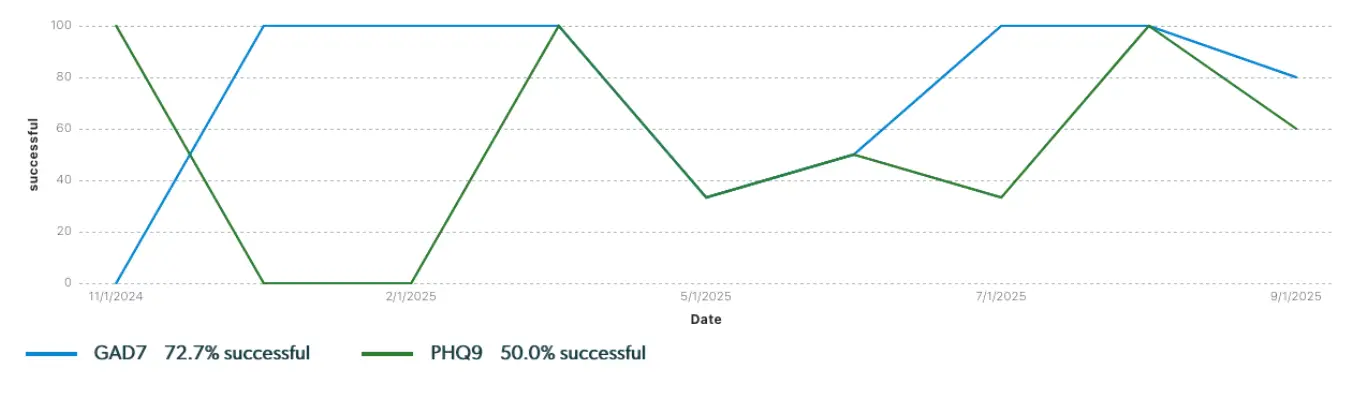
These graphs display the same information. The only difference is the placement of the legend. These graphs also display the same information as the corresponding effectiveness and efficiency metrics they're composed of.
Next Steps
Now that you understand what the Statistics mean based on your metric settings, feel free to adjust more of your settings to understand your patient population! We recommend adjusting the settings for each of the statistics to understand how they chance. Information on how to adjust each are in the bullet description of each statistic.