
Outcomes Framework - Tutorial

The goal of this tutorial is to get you exploring your data to create metrics. Before deciding on permanent metrics, take the time to explore your data and learn how it works.

To get going, here are some high level concepts in the framework to get you started:​

  • Effectiveness Metrics are metrics that measure how treatment episodes have progressed at a fixed point in time. For example, ‘% of patients who achieved remission by the end of month 3 of treatment episode’. The third month of the treatment episode is the fixed point of time. This is the recommended type of metrics to start with. Learn more about metric types here.
  • Treatment Episode Response denotes the extent to which a patient improves during treatment episode, regardless of the presence or absence of symptoms at the baseline measurement. It will be one of the ways used to count the number of ‘successes’ in your outcomes set. More information on these characteristics can be found here.
  • Treatment Episode Remission denotes the return to a non-clinical level of symptoms. It will also be used to count the number of ‘successes’ in your outcomes set. More information on these characteristics can be found here.

Most of our customers primarily measure success on the PHQ-9 and GAD-7. If this does not apply to you, you will need to identify the primary scale for your first metric.

If you already know how to find the Outcomes Dashboard and open the menu to create a metric, skip to Selecting a Preset Metric. If not, read below first.​

1). Measurement-Based Care: Log into the Mirah platform. You should see an "Outcomes" tab at the top of the page. Clicking on it will bring you to the Outcomes Dashboard. If this is your first time your organization has used the Outcomes Framework, you will see a message telling you that you have no metrics.
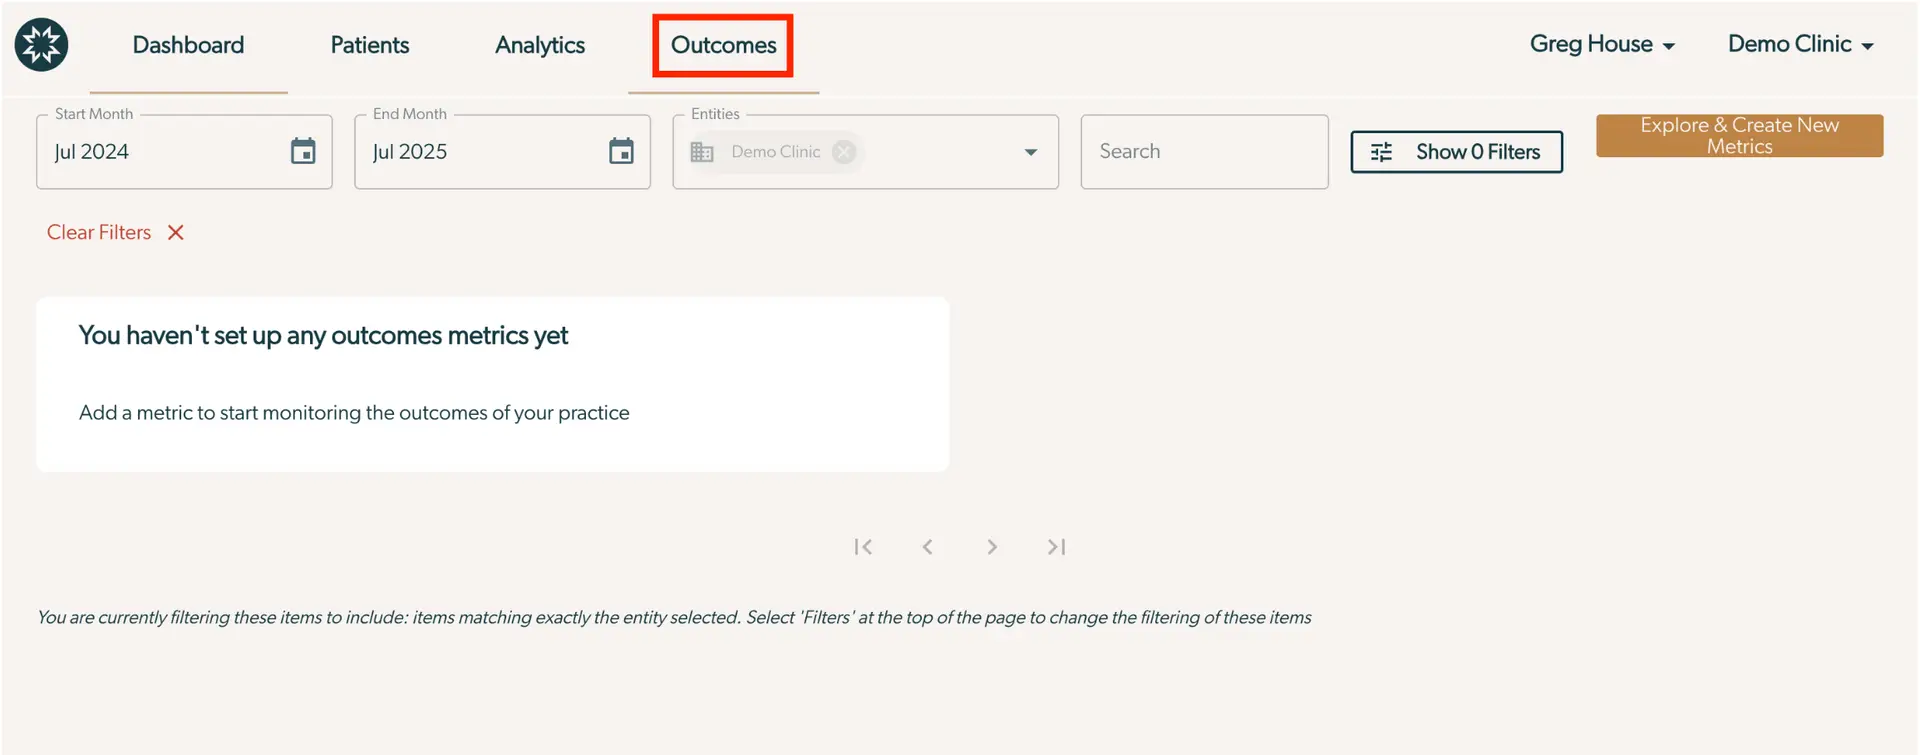
The screenshot displays the Outcomes section of the Mirah Measurement-Based Care platform, where users can set up metrics to monitor practice outcomes. The top navigation bar includes tabs for Dashboard, Patients, Analytics, and Outcomes, with Outcomes highlighted. The user profile is shown as Greg House, and the selected clinic is Demo Clinic. Below the navigation, there are fields for selecting the start month, end month, and entities, with the current selections being July 2024, July 2025, and Demo Clinic, respectively. A search field is available for filtering, and a button labeled 'Show 0 Filters' is located to the right. The main area of the screen indicates that no outcomes metrics have been set up yet, with a prompt to add a metric for monitoring practice outcomes. A button labeled 'Explore & Create New Metrics' is positioned on the right side. At the bottom, there is a note about the current filtering settings and navigation arrows for pagination.

2). Collaborative Care: Log into the Mirah platform. On the vertical menu, click on the dropdown menu to the right of "Metrics" and select the "Outcomes" tab. Clicking on it will bring you to the Outcomes Dashboard. If this is your first time your organization has used the Outcomes Framework, you will see a message telling you that you have no metrics.
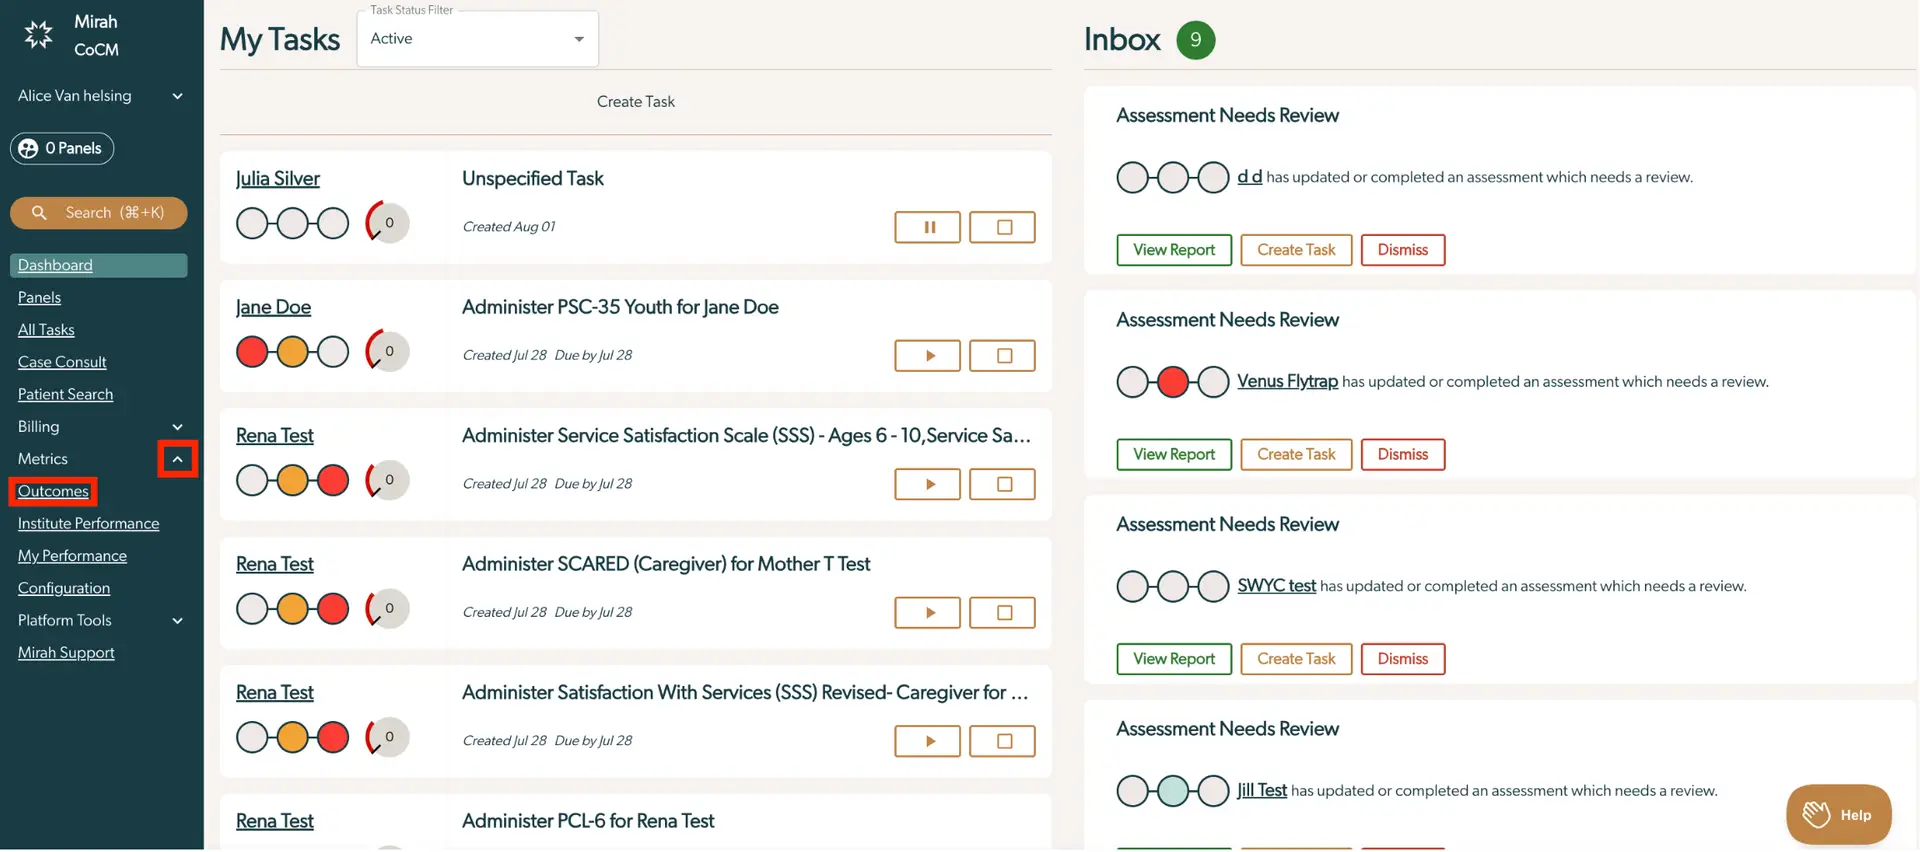
The screenshot displays the Mirah Measurement-Based Care interface, focusing on the 'My Tasks' and 'Inbox' sections. On the left side, a vertical navigation menu lists options such as Dashboard, Panels, All Tasks, Case Consult, Patient Search, Billing, Metrics, Outcomes, Institute Performance, My Performance, Configuration, Platform Tools, and Mirah Support. The 'Outcomes' section is highlighted, indicating the current focus. The main area is divided into two columns: 'My Tasks' on the left and 'Inbox' on the right. 'My Tasks' shows a list of tasks assigned to different users, including Julia Silver, Jane Doe, and Rena Test, with details like task type, creation date, and due date. Each task has buttons for play, pause, and stop, located to the right of the task details. The 'Inbox' section lists assessments needing review, with entries for users like Venus Flytrap and SWYC test. Each entry includes a status indicator, user name, and buttons for 'View Report,' 'Create Task,' and 'Dismiss,' located to the right of the assessment details. The top of the screen features a task status filter set to 'Active,' and a 'Create Task' button. The bottom right corner has a 'Help' button.

3). Measurement-Based Care AND Collaborative Care: Click “Explore & Create New Metric” pictured in the top right hand corner of your screen to set up your first metric.

The screenshot displays a section of the Mirah Measurement-Based Care platform focused on Reporting & Analytics. It includes fields for selecting a Start Month and End Month, both set to July 2024 and July 2025 respectively, with calendar icons next to each for date selection. There is an Entities field with 'Demo Clinic' selected, accompanied by a building icon and a clear option. A Search field is present for querying specific data. A 'Show 1 Filter' button is located to the right of the Search field, allowing users to manage filters applied to the data. On the far right, a prominent button labeled 'Explore & Create New Metrics' is highlighted in orange, inviting users to delve into metric creation and exploration.

Please note that in the past we has supported an option to download data in CSV format; however, this option to no longer available.