Outcomes Framework - Quick Start Guide
The purpose of the Quick Start Guide is to allow you to start tracking outcomes framework metrics using defaults Mirah suggests.
Background
If you are curious, here is background information about the Outcomes Framework.
To log into Mirah and locate the "Outcomes" panel, follow this guide.
Creating Essential Metrics
At the top of the create page in the "Choose a template or start from scratch" section, select ‘Use the following template’ and type ‘Common Scales’ into the search box. You should see four available metrics:
- Remission - Common Scales - measures the % of patients who see remission in at least one symptom during treatment episode.
- Treatment Response OR Remission - Common Scales - measures the % of patients who see remission OR response to treatment in at least one symptom during treatment.
- Treatment Episode Response - Common Scales - measures the % of patients who see response on at least one symptom.
- Time To Treatment Episode Response - Common Scales - measures the average time taken to achieve treatment episode response on at least one common scale.
When you select the template in the dropdown. It will automatically populate all the appropriate configuration into the tool.
Find the "Save this metric and continue to track it" button and click it. You will be asked to select a name for the metric before you save it.
Once this is complete, you will be tracking several key metrics.
Tracking Essential Metrics
Now, if you navigate to your outcomes dashboard, metrics such as those pictured below are available to view:
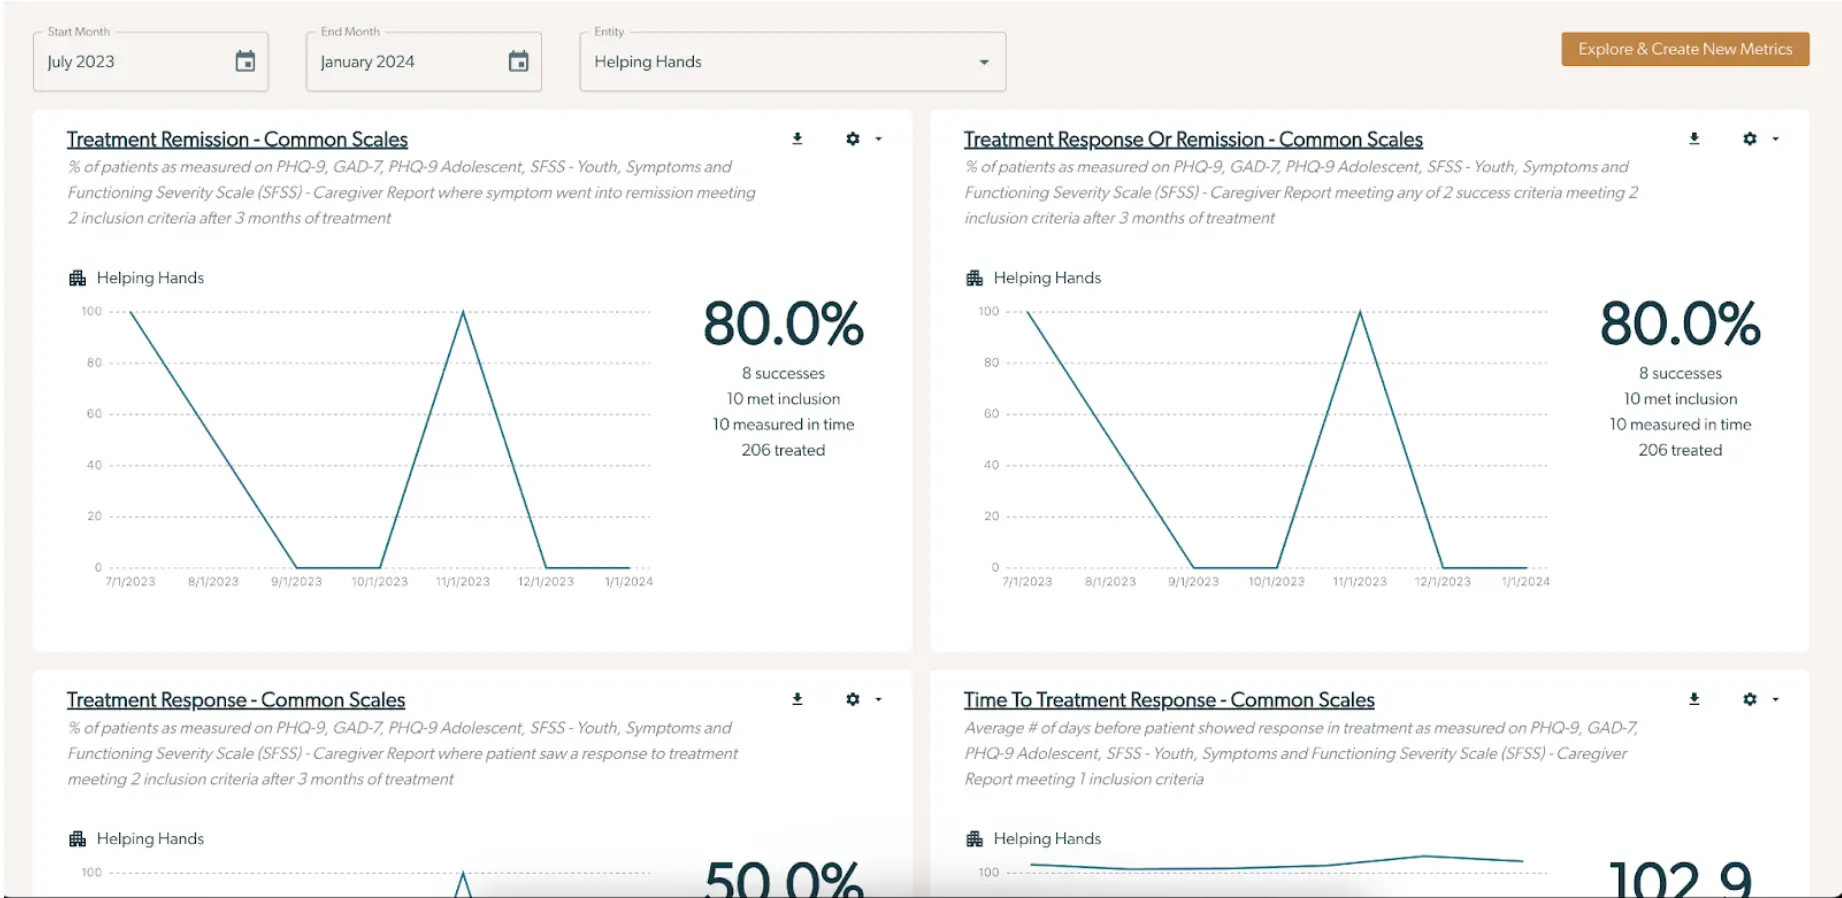
To find more details about each of these, click on the name of the metric.
Note that the "percentage of measures completed" is calculated off of active clients. Active clients are defined as having sessions scheduled in the Dashboard. Supervisors can filter this setting by using the "In Treatment" flag displayed below.

Congratulations, you are now tracking essential outcomes metrics for your practice!
Some next steps to consider:
- Click through our Tutorial to build your own metrics
- See Glossary of articles
- Filter by entity (e.g. a particular organization or provider)
- Understand the existing metrics
Please note that in the past we has supported an option to download data in CSV format; however, this option to no longer available.