Outcomes Framework - Cohort Type
Cohort Type allows you to select whether you would like to measure against a cohort of patients who started treatment during a given period or a cohort of patients who were active in treatment in a certain period. Cohort Type applies to both Effectiveness and Efficiency Metrics.
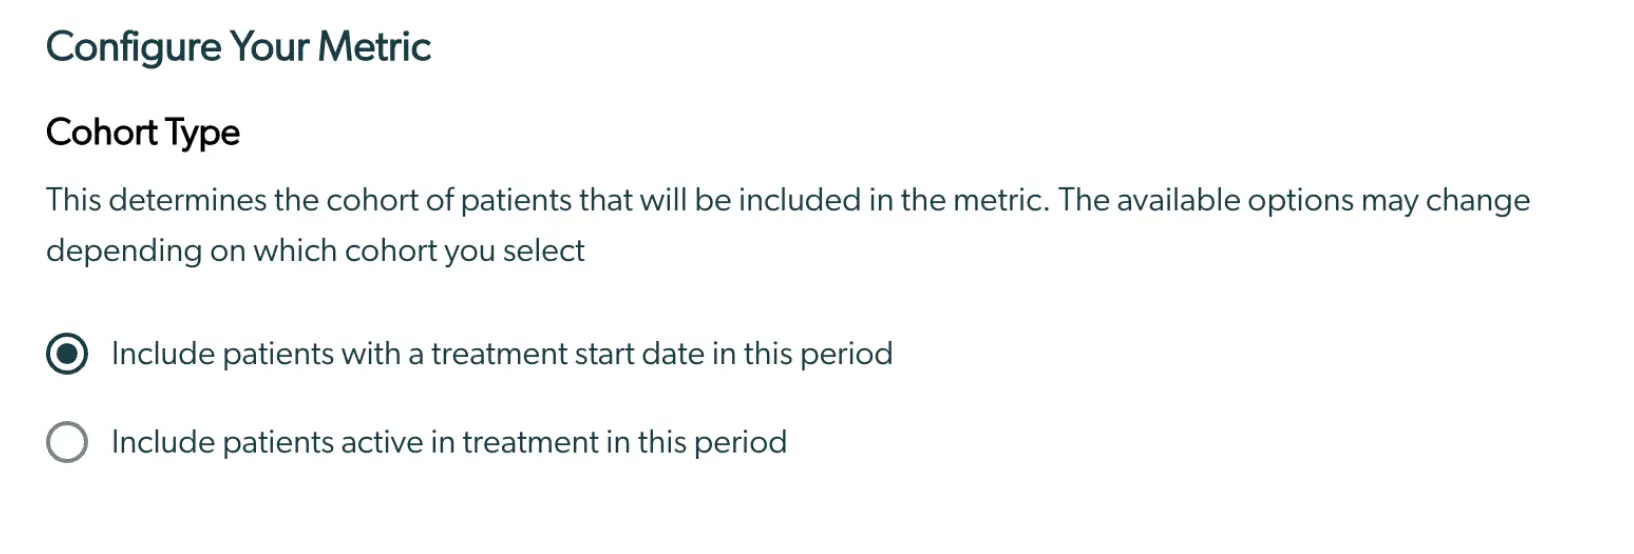
The following items should be considered when selecting the Cohort Type:
- All patients who are active for any part of the period in question will be counted.
- This includes patients who were discharged during the period, as well as patients still in care.
- Patients must have at least 2 assessments completed to be counted for the cohort.
- Outcomes are evaluated at the end of the period in question, rather than when the measurement was completed.
- For example, if you are looking for results for patients active in the month of October, and a patient completed an assessment on October 14th, their length of service would be through the end of October
- Assessments can be completed in a prior period - for example, if the last assessment a patient took was in September, this would still be the assessment used to calculate the outcomes for October.
- For the total metric, each patient is only counted once
- For example, if you select a period of June-August, the denominator will be:
* All unique patients active at all in June, July or August.
- For example, if you select a period of June-August, the denominator will be:
- On breakdown month-by-month graph, each patient is evaluated for that month
- It is the equivalent of running separate reports for June, July, August.
- If you sum up the denominators for each, you will get a total which represents the total number of treatment months across those months.