
How to Use Billing Insights

The Billing Insights (BI) guides Care Managers towards the most efficient use of their time throughout each billing month. We recommend that Care Managers periodically review the BI report throughout the month (at least weekly). More importantly, during the last week of each month, we recommend that Care Managers check this report at least daily to ensure efficient use of their time before the close of each billing month. Carefully following the BI recommendations will help maximize your efficiency related to patient care and billing time.

Instructions to access Billing Insights​

1). Using the lefthand menu, select "Billing" and then "Billing Insights".
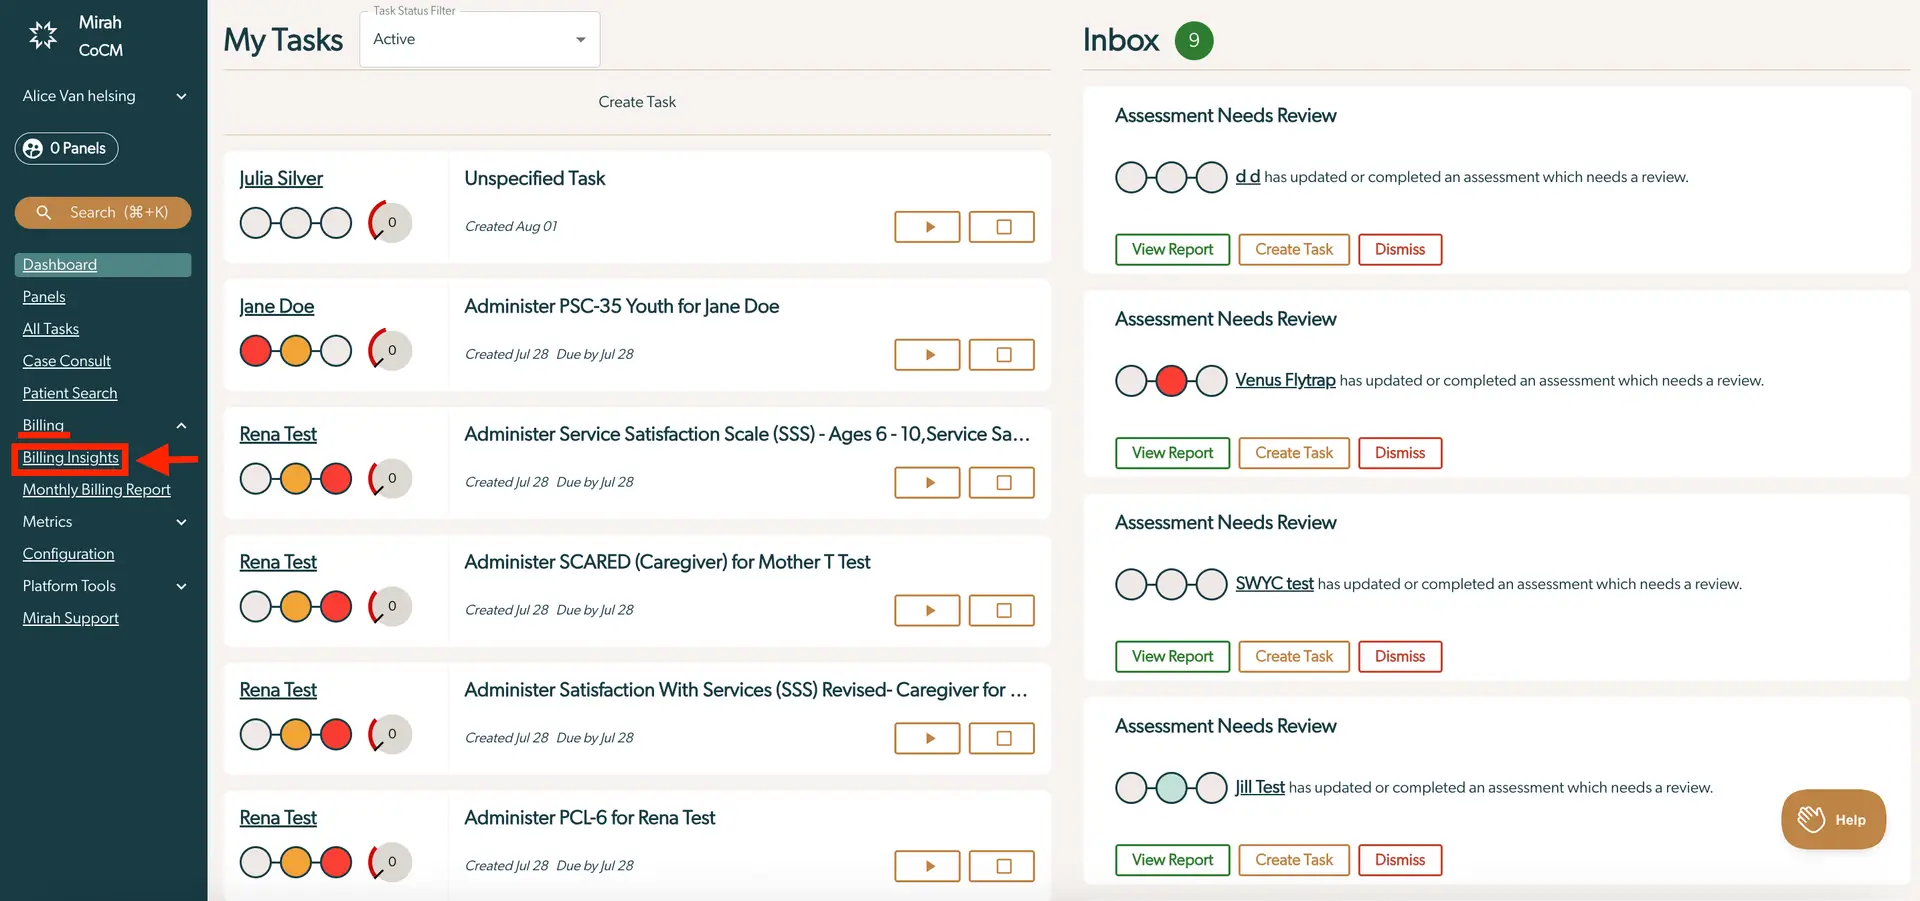
The screenshot displays the Mirah Collaborative Care interface, focusing on the 'Billing Insights' section. On the left side, a vertical navigation menu lists options such as Dashboard, Panels, All Tasks, Case Consult, Patient Search, Billing, Monthly Billing Report, Metrics, Configuration, Platform Tools, and Mirah Support. The 'Billing Insights' option is highlighted, indicating the current selection. The main area is divided into two sections: 'My Tasks' and 'Inbox'. 'My Tasks' shows a list of tasks assigned to different users, including Julia Silver, Jane Doe, and Rena Test, with task details like creation date and due date. Each task has buttons for play and stop, located to the right of the task details. The 'Inbox' section lists assessments needing review, with entries for users like d d, Venus Flytrap, SWYC test, and Jill Test. Each entry includes buttons for 'View Report', 'Create Task', and 'Dismiss', located at the bottom of each assessment entry. The 'Help' button is located at the bottom right corner of the screen.

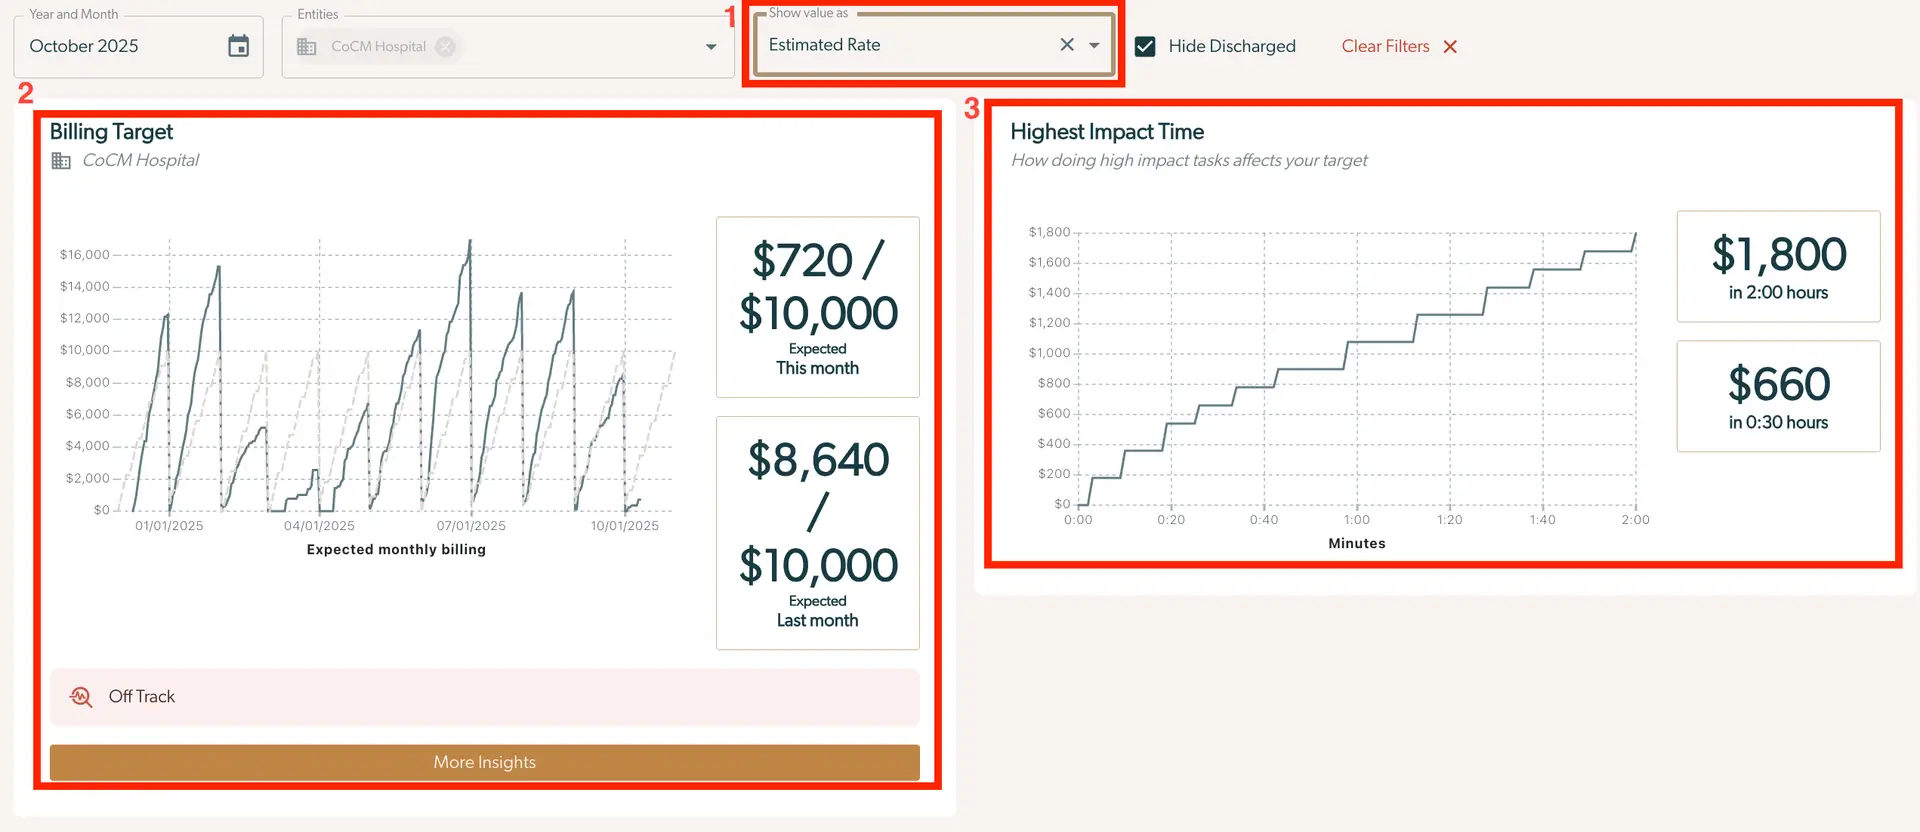
2). At the top of the screen, two graphs are pictured side by side. The left graph (2) changes dependent on the filter (displayed as the number 1). The graph on the right (3) stays constant and depicts the amount of revenue users can bill for in 2 hours and 30 minutes (the amount of hours can be changed on an institute level). This serves as a very helpful tool as it displays patients with time labeled as high impact and provides a useful summary.

  • (1) The four filters offered as values include "Estimated Rate," "Billable Time," "RVUs" and "Care Units."
  • (2) Dependent on the filter, this graph will change:
    • Estimated Rate = Billing target for the month
    • Billable Time = Billable time targets for the month
    • RVUs = RVU target for the month
    • Care Units = Care unit target for the month
  • (3) This graph stays constant across all filters and clearly articulates patients with the highest impact in that the least amount of time committed translates to the most reimbursement amount. The screenshot displays the Billing Insights feature of Mirah Collaborative Care, focusing on the financial performance of CoCM Hospital for October 2025. At the top, there are filters for 'Year and Month' and 'Entities', with October 2025 and CoCM Hospital selected. The 'Show value as' dropdown is set to 'Estimated Rate', and there are options to 'Hide Discharged' and 'Clear Filters' on the right. The main section is divided into two panels. The left panel, titled 'Billing Target', shows a graph of expected monthly billing from January to October 2025, with a current month expectation of $720 out of $10,000 and last month's achievement of $8,640 out of $10,000. Below the graph, an 'Off Track' status is indicated, and a 'More Insights' button is located at the bottom. The right panel, titled 'Highest Impact Time', illustrates how high-impact tasks affect billing targets, with a graph showing incremental billing over time, reaching $1,800 in 2 hours and $660 in 30 minutes.
3). Scroll to the bottom of the screen where you will see a list of all currently enrolled patients.
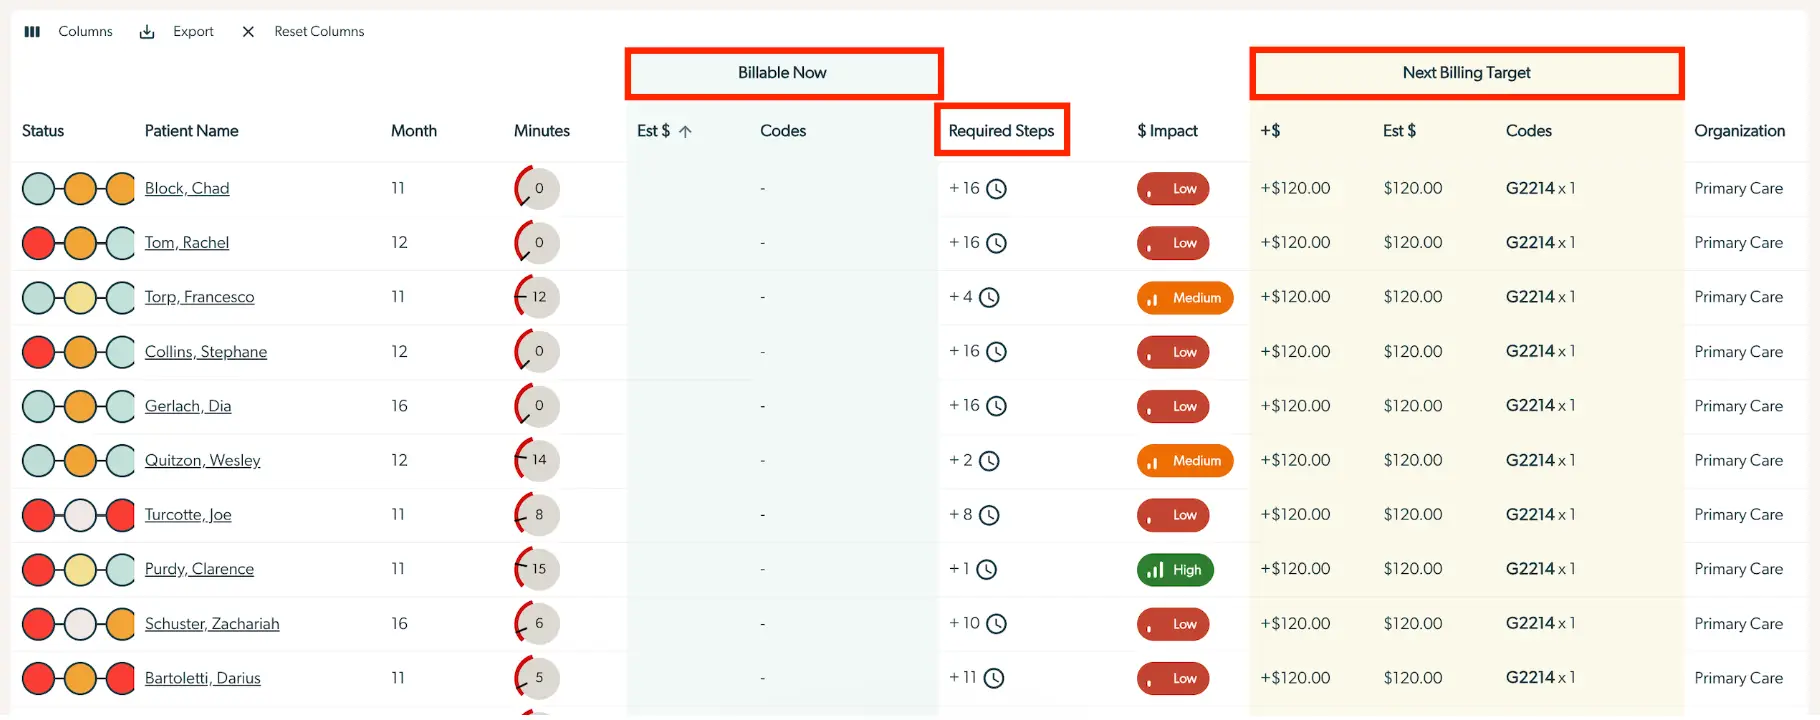
The screenshot displays the Billing Insights feature of Mirah Collaborative Care, focusing on the billing status and targets for patients. The table is divided into columns: Status, Patient Name, Month, Minutes, Billable Now, Required Steps, Next Billing Target, Estimated Dollar Amount, Codes, and Organization. The Status column uses colored circles to indicate the current billing status of each patient. The Patient Name column lists the names of patients, followed by the Month and Minutes columns which show the month and minutes associated with each patient. The Billable Now section is highlighted, showing the estimated dollar amount and codes for billing. The Required Steps column indicates additional steps needed for billing, with a clock icon and a numerical value. The Next Billing Target section is also highlighted, showing the estimated dollar amount, codes, and organization type, which is Primary Care for all entries. The $ Impact column uses colored labels to indicate the financial impact, ranging from Low to High, and the +$ column shows the potential additional revenue. The Export button is located at the top left, allowing users to export the data, and the Reset Columns button is available to reset the table view.

Billable Now: Based on the current information available in the Mirah platform (such as minutes tracked in the month, or assessment completion) this is what can currently be billed.

Required Steps: The steps required to reach the next billable threshold. See the next section on what each of the Required Steps mean.

Next Billing Target: If the required steps are met, this will be the next billable target.

Required Steps​

Complete Assessment: an assessment needs to be completed according to the rules specified in your billing algorithm for this patient.

Additional Time: The number of additional billable minutes required to unlock the next code.

Begin Active Treatment: To be billable this patient must be moved into Active Treatment.

Please Note​

Billing thresholds are set by each organization. This report is meant to be used as a guide. Provider organizations should always verify that the billing codes are correct before submitting bills.

Checking Billing Algorithm Logic​

1). Scroll to the bottom of the Billing Insights page until you see "View Billing Algorithm Details" on the left bottom of the page.

The screenshot displays a hyperlink labeled 'View Billing Algorithm Details'. This link is intended for users to access detailed information about the billing algorithms used within the Mirah Collaborative Care platform. It is part of the Billing Insights feature, which aids in understanding and optimizing billing processes in collaborative care settings. The link is centrally positioned and underlined, indicating it is clickable and will redirect users to a page with more comprehensive billing details.

2). Click the Billing name in the table.

The screenshot displays the Billing Insights feature within the Mirah Collaborative Care platform, specifically focusing on the management of billing algorithms. At the top, there are two dropdown menus labeled 'Entities' and 'Status', allowing users to filter billing information by specific entities, such as CoCM Hospital, and by status, such as Active. Below these filters, there is a table with columns labeled 'Name', 'Applies to', 'Start Date', 'End Date', and 'Codes'. The table lists a billing algorithm named 'Default Billing', which applies to CoCM Hospital, with a start date of 11/13/2023 and an end date status of 'Active Now'. The associated billing codes are 99492, 99493, 99494, and G2214. On the top right corner, there is a button labeled 'Create Algorithm', which allows users to initiate the creation of a new billing algorithm.

3). The "Billing Codes" section shows the value of each code.

The screenshot displays the Billing Insights feature within the Mirah Collaborative Care platform, focusing on the Default Billing and Billing Codes sections. The Default Billing section provides details about the billing status, which is marked as 'Active', the entity it applies to, 'CoCM Hospital', the start date of '11/13/2023', and the end date, which is 'Active Now'. Below, the Billing Codes section highlights a specific billing code '99492', with associated financial details including the average cost per unit, which is $350.00, the number of care units, which is 1, the RVUs per unit, which is 1.88, and a checkmark indicating that it qualifies as an initial encounter.

4). The "Rules" section shows the requirements for a code to count.

The screenshot displays a section titled 'Rules' which outlines billing criteria for collaborative care. It includes 'Rule 1' with details such as 'Billable Minutes' set at 190, 'Minimum Minutes Required' at 176, and indicators for 'Requires Assessment Completed' and 'Must be billed as initial encounter' both marked with check symbols, indicating completion or requirement. 'Must be billed as subsequent encounter' is marked with a prohibition symbol, indicating it is not applicable. On the right side, billing codes '99492' and '99494' are listed with their respective multipliers 'x1' and 'x4', signifying the number of times each code is applicable.