
Generating an End of Month Report

It is recommended to use the Billing Insights report to generate an “end of the month” report which will guide users towards the most efficient use of their time at the end of each billing month.

Best practice guidelines:

  • Download the report (instructions below) about 5 business days before the end of the month
  • Focus on the items at the top of the list, which will ensure the most efficient use of time at the end of the month
  • Re-generate the report 1-2 days before the end of the billing month, if needed, to provide updated guidance

How to generate the End of the Month Report​

1). Use the menu on the left and select "Billing" which provides a dropdown list. From there, click on "Billing Insights".
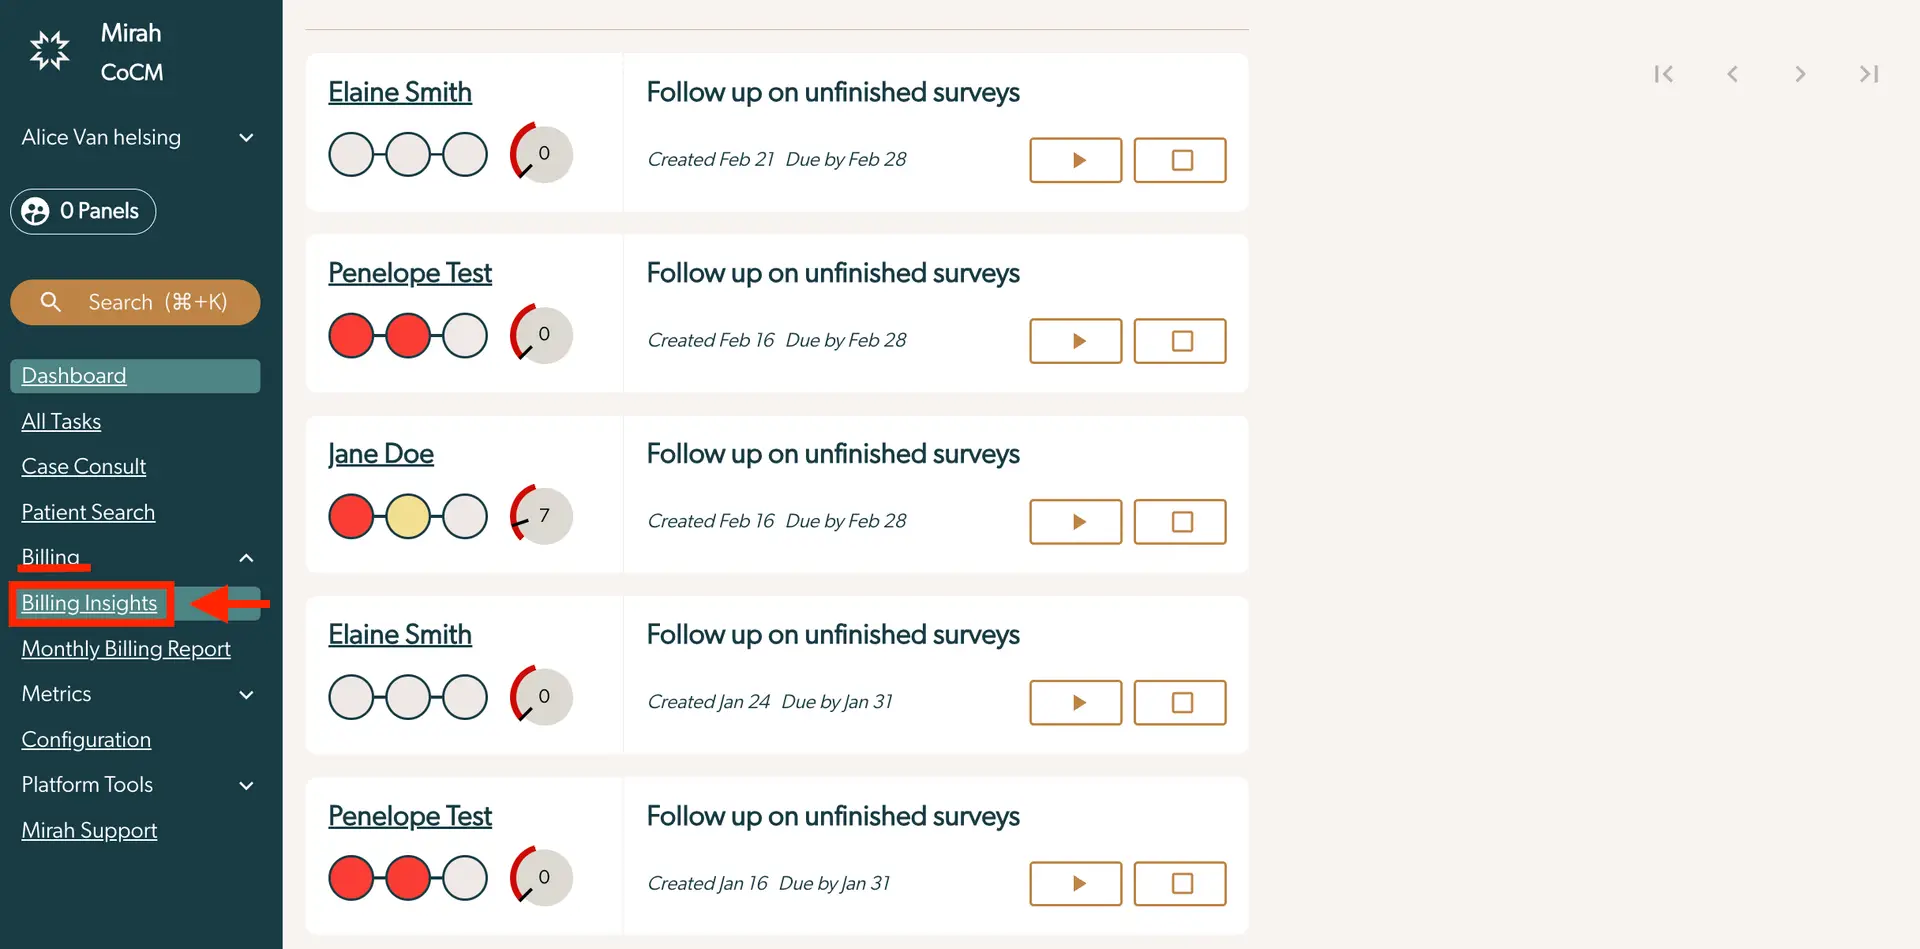
The screenshot displays the Billing Insights section of the Mirah Collaborative Care platform, which is part of the end-of-month report generation process. On the left side, there is a navigation menu with options such as Dashboard, All Tasks, Case Consult, Patient Search, Billing, Monthly Billing Report, Metrics, Configuration, Platform Tools, and Mirah Support. The Billing section is expanded, highlighting Billing Insights. The main area shows a list of patients with their names, Elaine Smith, Penelope Test, Jane Doe, and Elaine Smith again, along with a task description 'Follow up on unfinished surveys.' Each entry includes a visual progress indicator with colored circles and a number indicating the count of unfinished surveys. The creation and due dates are specified, such as 'Created Feb 21 Due by Feb 28.' There are two buttons next to each entry, a play button and a stop button, for managing tasks. Pagination controls are located at the top right corner of the screen.

2). Scroll to the bottom of the screen where you will see a list of all currently enrolled patients. Use the filter at the bottom of the screen to include up to 100 rows per page.
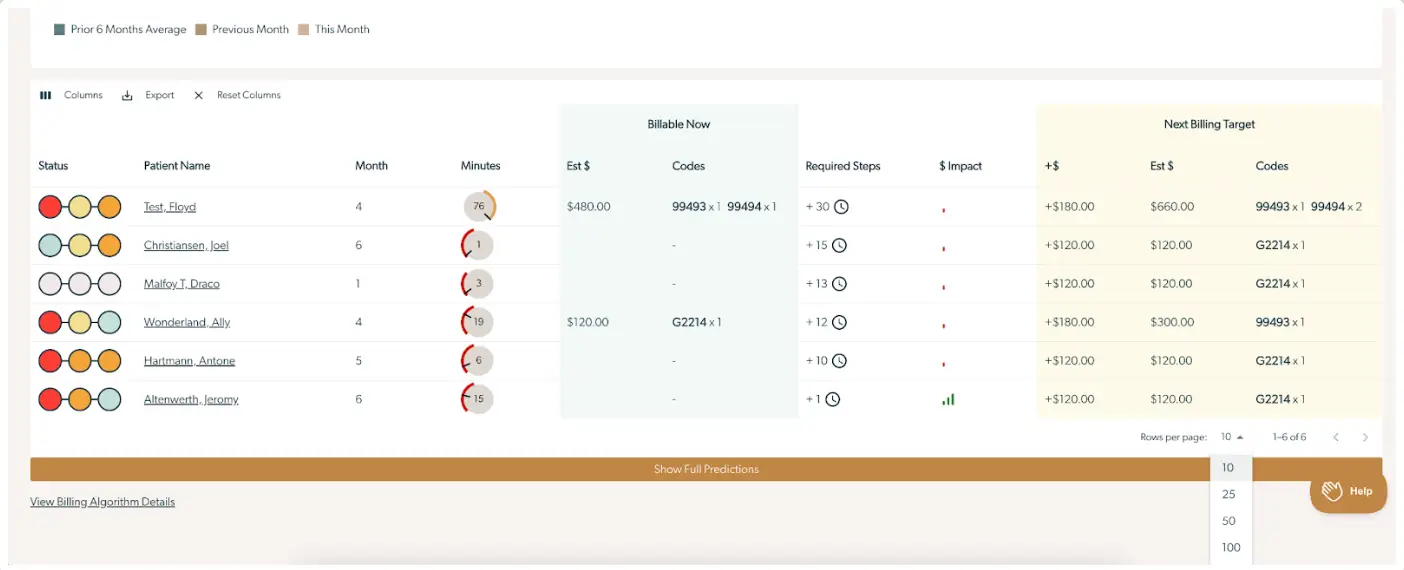
The screenshot displays the Billing Insights feature of Mirah Collaborative Care, focusing on generating an end-of-month report. The interface includes a table with columns labeled Status, Patient Name, Month, Minutes, Billable Now, Required Steps, $ Impact, Next Billing Target, +$, Est $, and Codes. Each row represents a patient with details such as their name, the month of service, and the minutes spent. The Billable Now section shows estimated billing amounts and codes, while the Next Billing Target section projects future billing amounts and codes. The table allows users to filter columns, export data, and reset columns using buttons located at the top left. The bottom of the screen includes a button labeled 'Show Full Predictions' and a link to 'View Billing Algorithm Details.' The 'Help' button is located at the bottom right corner, and a dropdown menu for selecting the number of rows per page is present at the bottom right.

3). Click on the button for Columns on the top left corner of this section of the page. Use the checkboxes to select the columns you would like to include in the report. Minimally, we recommend including:

  1. Patient name
  2. Care Manager
  3. Month
  4. Minutes
  5. Current billing codes
  6. $ Impact to Next
  7. Required Steps to Next
  8. Next Billing Codes The screenshot displays a dropdown menu used for customizing the view of a report in the Mirah Collaborative Care platform. At the top, there is a search field allowing users to quickly find specific columns to display. Below the search field, there are several checkboxes corresponding to different data fields: DoB (Date of Birth), Care Manager, PCP (Primary Care Provider), Month, Minutes, Current Est $ (Current Estimated Dollars), Current RVUs (Relative Value Units), and Current Care Units. Users can select or deselect these checkboxes to show or hide specific columns in the report. At the bottom of the dropdown, there are two buttons: 'Show/Hide All' which allows users to toggle the visibility of all columns at once, and 'Reset' which reverts any changes made to the default settings. The dropdown menu is part of the Billing Insights feature, aiding in generating an end-of-month report.

4). Sort the columns by $ Impact so that the items with highest impact (icon with three green bars) are at the top).
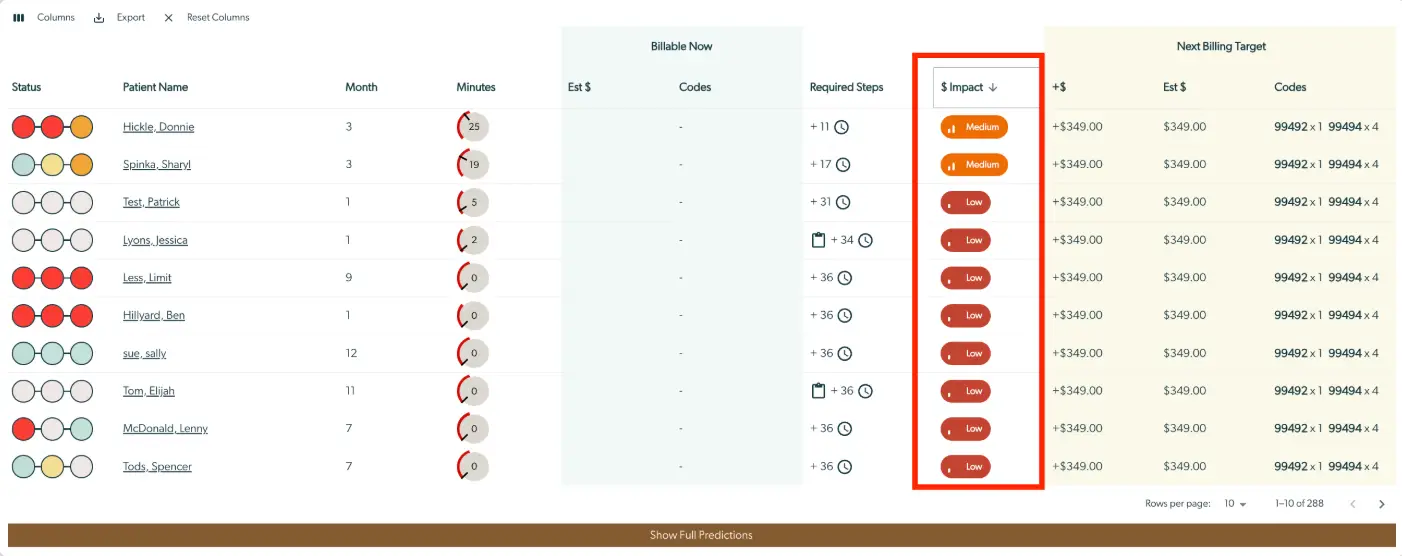
The screenshot displays the Billing Insights feature of Mirah Collaborative Care, focusing on generating an end-of-month report. The table is divided into two main sections: 'Billable Now' and 'Next Billing Target'. The 'Billable Now' section includes columns for patient status, patient name, month, minutes, estimated dollar amount, codes, and required steps. The 'Next Billing Target' section includes columns for potential dollar increase, estimated dollar amount, and billing codes. Each row represents a patient, with their name hyperlinked for further details. The status column uses colored circles to indicate the patient's billing status. The minutes column shows the time spent with each patient, and the required steps column indicates the number of steps needed for billing completion. The '$ Impact' column, highlighted in red, shows the financial impact of billing actions, categorized as medium or low. At the top, there are options to manage columns, export data, and reset columns. At the bottom, there is a 'Show Full Predictions' button, and pagination controls are available to navigate through the report pages.

5). Click on the button for Export and select “Download as CSV”. This will download a .csv file which can be opened in Excel or Google sheets. If desired, the CSV file can be filtered by Care Managers.

The screenshot displays a section of the Mirah Collaborative Care interface focused on generating an end-of-month report within the Billing Insights feature. At the top left, there is a 'Columns' button represented by three vertical lines, which allows users to customize the columns displayed in the report. Next to it is the 'Export' button, highlighted in red, featuring a downward arrow icon, enabling users to export the report data. To the right is the 'Reset Columns' button marked with an 'X', which resets any column customizations to default settings. Below these buttons, there is a 'Download as CSV' option, indicating that the report can be downloaded in CSV format for further analysis or record-keeping.