Interpreting the Enhanced Feedback Report

Mirah presents client-level clinical feedback in a comprehensive, interactive report. This report is the core of Mirah for clinicians using the platform and provides invaluable insight to guide care and clinical decision making.

**Please Note: Not all Mirah customers have access to the Enhanced Feedback Report. If this interface does not look familiar to you, and you're interested in learning more, please reach out to your Customer Success Manager or email support@mirah.com.

Understanding the Layout​

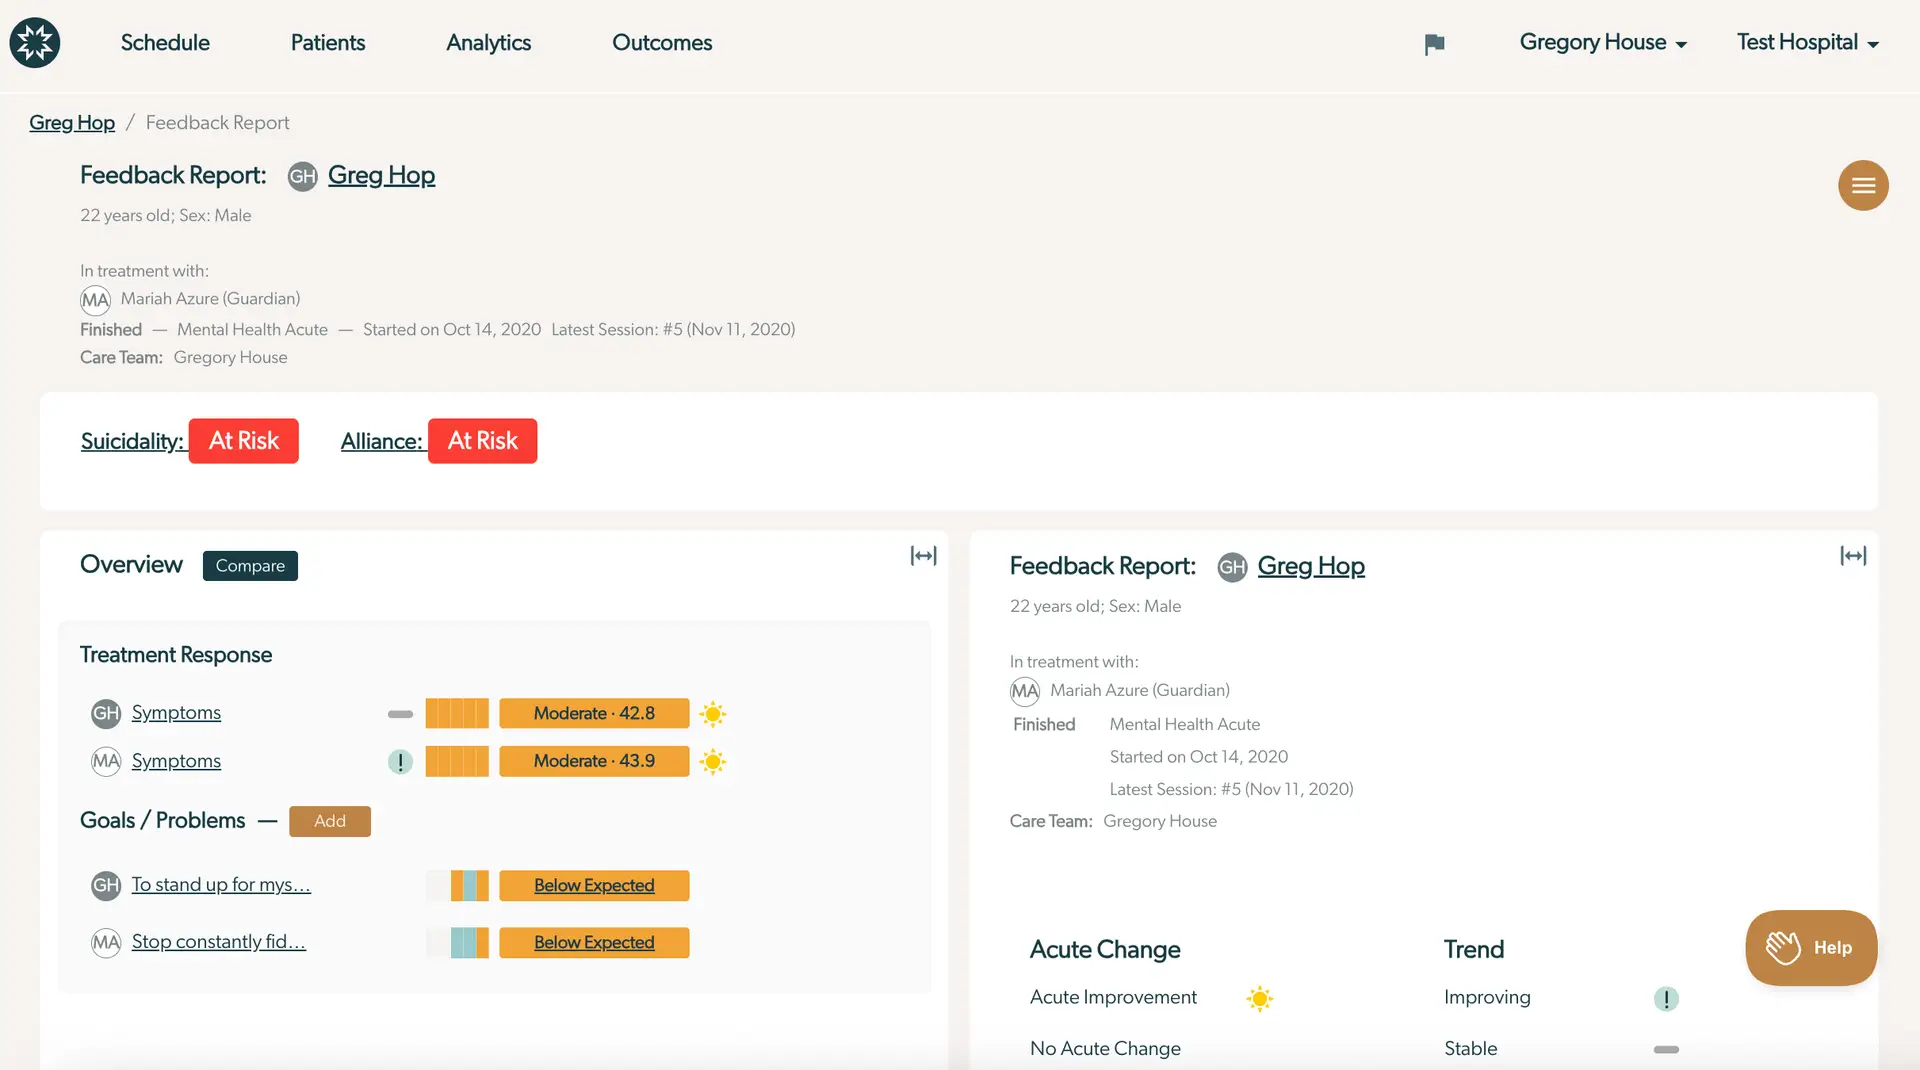
The screenshot displays the Enhanced Feedback Report for a patient named Greg Hop, who is 22 years old and male. The report is part of the Mirah Measurement-Based Care platform, under the Feedback Report section. The top navigation bar includes options for Schedule, Patients, Analytics, and Outcomes. The breadcrumb trail shows 'Greg Hop / Feedback Report'. The report indicates that Greg is in treatment with Mariah Azure (Guardian) and is part of the care team led by Gregory House. The treatment details show that the mental health acute program started on October 14, 2020, with the latest session being number 5 on November 11, 2020. The report highlights two risk factors: Suicidality and Alliance, both marked as 'At Risk' in red. The Overview section includes a 'Compare' button and displays Treatment Response with symptom scores for Greg Hop and Mariah Azure, both marked as 'Moderate' with scores of 42.8 and 43.9 respectively. The Goals/Problems section lists goals for both individuals, marked as 'Below Expected'. The right panel summarizes the feedback report for Greg Hop, reiterating treatment details and care team information. It also shows Acute Change with options for 'Acute Improvement' and 'No Acute Change', and a Trend section indicating 'Improving' and 'Stable'. A 'Help' button is located at the bottom right corner.

Orienting to the Report Layout​

Header

At the top of the screen, you’ll find basic information about the client. Initials presented in a dark gray circle indicate the client and their associated information and responses. Initials visualized in the light gray circle, if present, represents the caregiver. Throughout the report, you can always tell who the respondent for an item was by looking to the left of the measure for these identifiers. Other pertinent information includes client demographics, information about the active care episode, and the care team.
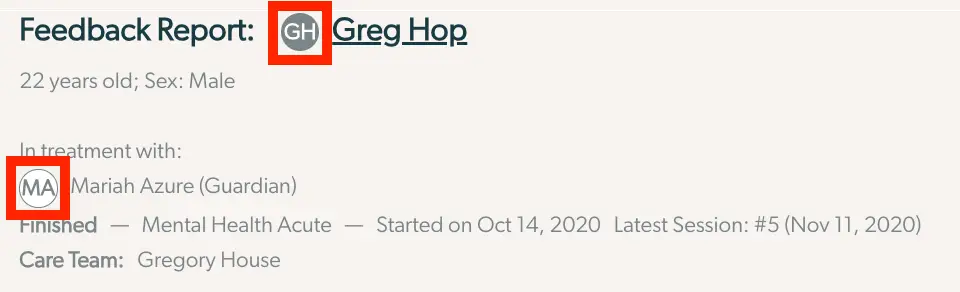
The screenshot displays the Enhanced Feedback Report for a patient named Greg Hop, indicated by the initials 'GH' next to his name. The report provides demographic details including age, 22 years old, and sex, male. It lists the treatment details, showing that Greg is in treatment with Mariah Azure, who is identified as his guardian with the initials 'MA'. The treatment program is Mental Health Acute, which started on October 14, 2020, and the latest session was the fifth one, held on November 11, 2020. The care team is led by Gregory House. The layout is simple, with the patient's name and initials prominently displayed at the top, followed by personal and treatment information in a clear, concise format.

Risk Screening

Underneath the basic information in the header, there is a section for risk screening. This presents critical information related to risk screening and management. If more information is needed for any of the risks, clicking on the badge will bring up the most recent item responses in the right “Details” panel. From there, using the navigation at the top of the right hand panel, the user can view the entire risk history and item responses from past dates. See “Badge Details: Responses” below for more information.

There are three risk badges that may be present, based on the administered scales. They are:

  • Suicidality
  • Alliance
  • Substance Use
  • Medications The screenshot displays a section of the Enhanced Feedback Report within the Mirah Measurement-Based Care platform. It provides a quick overview of various health and treatment-related categories, each followed by a status indicator. The categories listed are Suicidality, Alliance, Substance Use, and Medications. Each category is followed by a status: 'Suicidality' is marked as 'Minimal', 'Alliance' is marked as 'At Risk' with a red background indicating urgency, 'Substance Use' is marked as 'Minimal', and 'Medications' is marked as 'No Concerns'. These indicators help healthcare providers quickly assess areas that may require attention or intervention.

Two Panel Layout

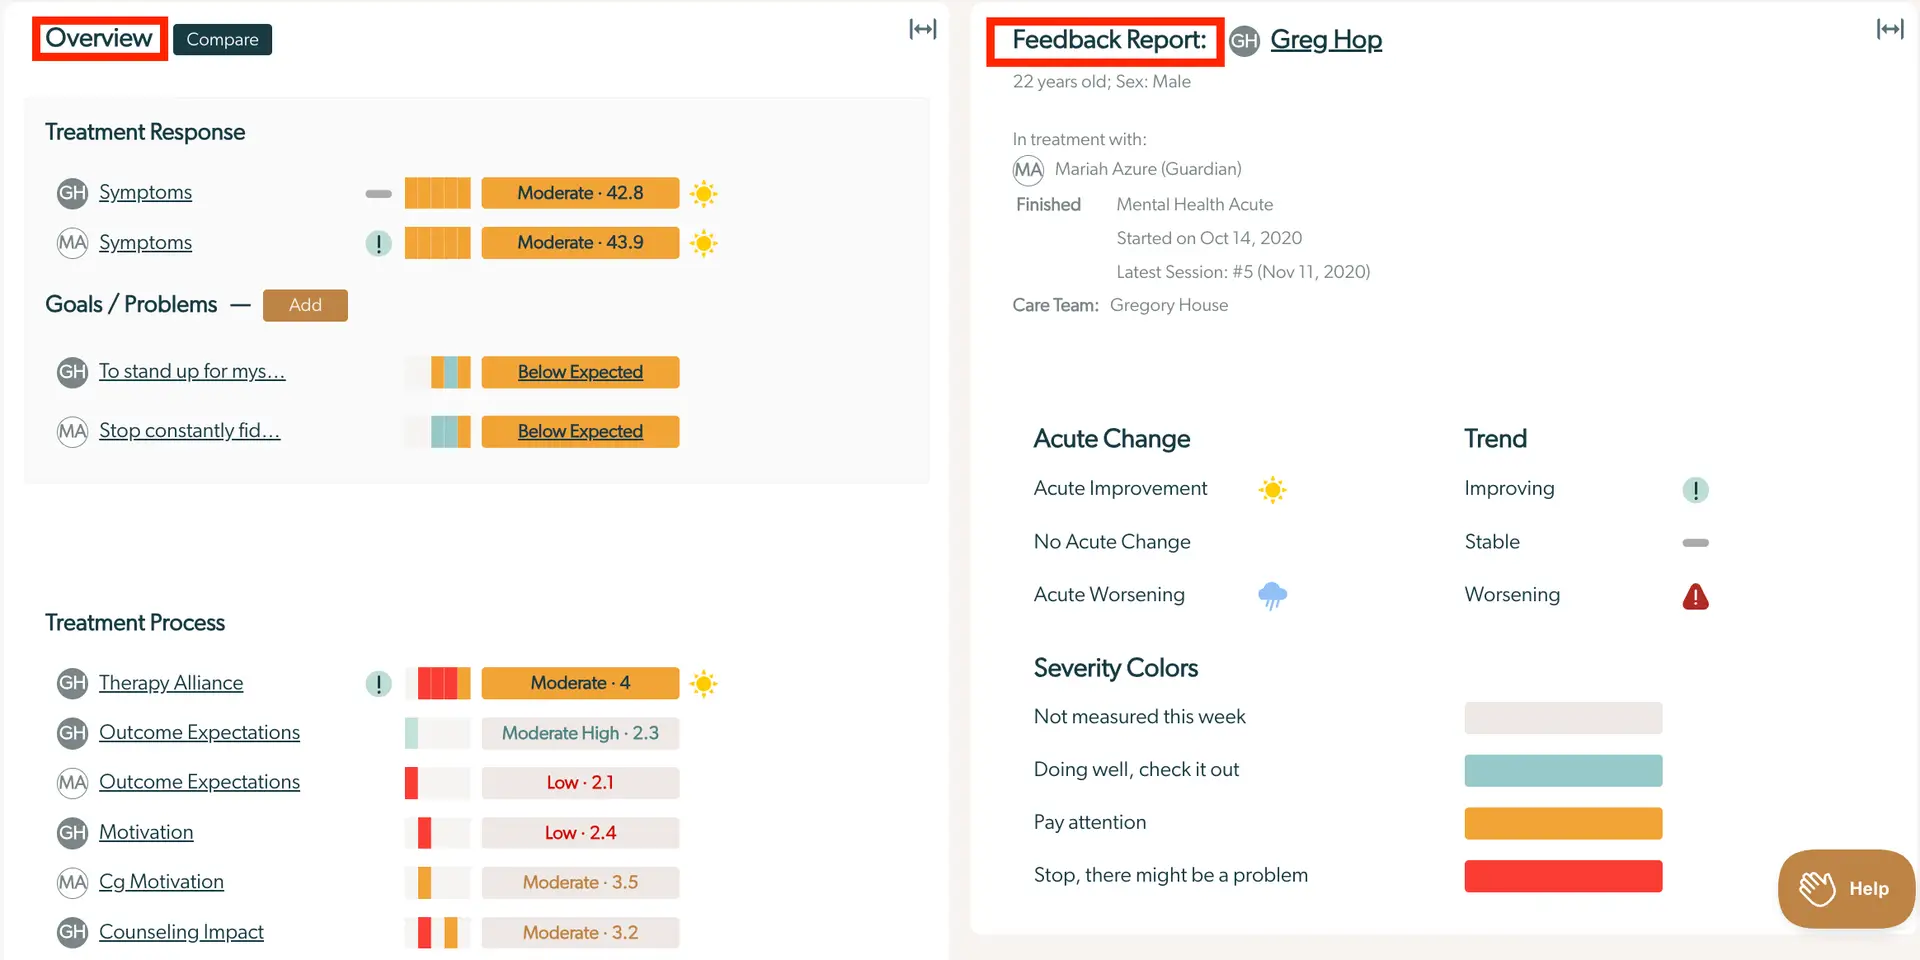
The screenshot displays the Enhanced Feedback Report for a patient named Greg Hop, aged 22, male. On the left side, under the 'Overview' tab, the report includes sections for 'Treatment Response', 'Goals / Problems', and 'Treatment Process'. Each section lists items with associated severity ratings and trends, such as 'Symptoms' and 'Therapy Alliance', with ratings like 'Moderate' and 'Below Expected'. The 'Add' button is available next to 'Goals / Problems' for adding new entries. On the right side, the 'Feedback Report' provides patient details including treatment status, care team, and session information. It also includes sections for 'Acute Change' and 'Trend', with icons indicating improvement, stability, or worsening. Severity colors are explained with corresponding actions, such as 'Doing well, check it out' and 'Stop, there might be a problem'. The 'Help' button is located at the bottom right corner.

The remainder of the report navigates between two panels. On the left “Overview” panel, the full overview or compare view will always be present. Within the right “Details” panel, the information will change based on what is selected from the left panel and how the navigation bar at the top of the right panel is utilized. At any time, the “Expand” button can be used to expand or minimize either panel, for more focused viewing.

The screenshot displays the top section of the Enhanced Feedback Report interface in Mirah Measurement-Based Care. On the left side, there is a tab labeled 'Overview' and a button labeled 'Compare' which allows users to compare different feedback reports. On the right side, the report is titled 'Feedback Report' for the individual named Greg Hop, who is 22 years old and male. The user's initials 'GH' are displayed in a circular icon next to the name. There is an icon with two arrows pointing outward located at the top right corner, which likely serves as a button to expand or adjust the view of the report.

Compare

Clicking the “Compare” button allows you to choose any measures by any reporter to view. This is useful to understand patterns or limit the amount of information to focus attention on something in particular. Select the measures that you’d like to compare using the checkboxes. This shows the graph of past responses for those measures within the left panel. The data points on this view are clickable and selecting one will populate details in the right panel (see below “Badge Details: Responses” for additional information on item level responses).
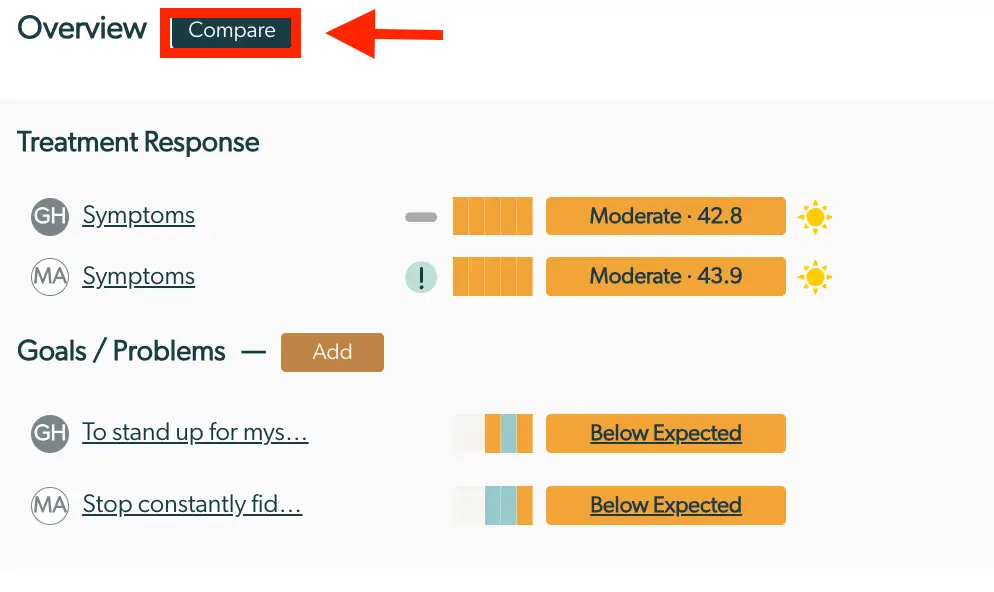
The screenshot displays the Enhanced Feedback Report within the Mirah Measurement-Based Care platform. At the top, there is a navigation label 'Overview' with a 'Compare' button highlighted in red, indicating its location for users to compare data. Below, the 'Treatment Response' section lists two entries labeled 'Symptoms' with initials 'GH' and 'MA', each accompanied by a bar graph, a moderate rating, and a numerical score (42.8 and 43.9 respectively), along with a sun icon suggesting positive progress. The 'Goals / Problems' section includes two entries with abbreviated text 'To stand up for mys...' and 'Stop constantly fid...', each showing a bar graph and a status of 'Below Expected'. An 'Add' button is present next to 'Goals / Problems' for users to add new goals or problems.

Treatment Response

Treatment response shows information related to how the client is progressing in treatment, such as symptoms and goal attainment. Using the “Add” button opens editable fields in the right panel that allow the clinician to add different types of goals for either the client or the caregiver from within the report.
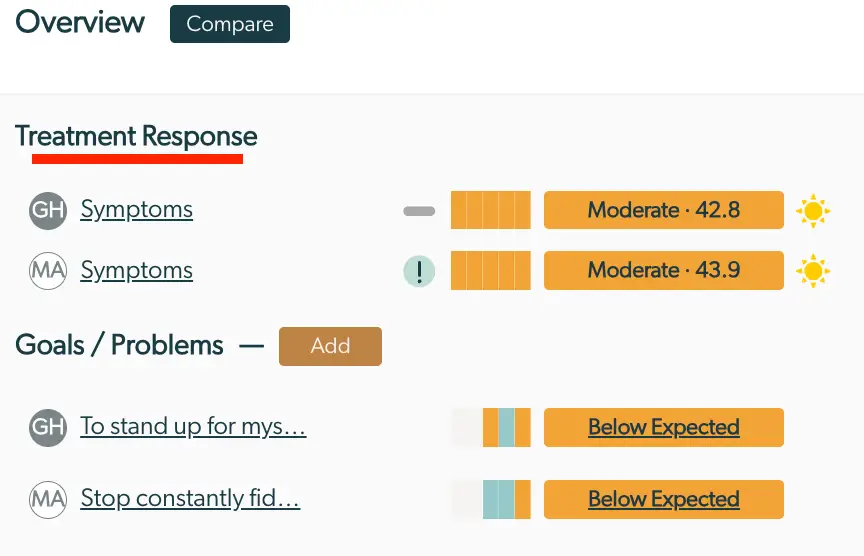
The screenshot displays the Enhanced Feedback Report within the Mirah Measurement-Based Care platform. At the top, there is a navigation bar with 'Overview' and 'Compare' options. Below, the section titled 'Treatment Response' is highlighted with a red underline. It lists two entries with initials 'GH' and 'MA' followed by 'Symptoms'. Each entry has a graphical representation of progress, a label indicating 'Moderate' with respective scores of 42.8 and 43.9, and a sun icon suggesting positive progress. The section 'Goals / Problems' follows, with an 'Add' button for adding new goals or problems. Two entries are listed with initials 'GH' and 'MA', each with a truncated goal description and a graphical representation indicating 'Below Expected' performance. The 'Add' button is located to the right of the 'Goals / Problems' heading.

Goals/Problems

The Goals section allows for tracking of goals progress, over time. Any goals or problems that the patient (and/or caregiver) have been working towards are highlighted here. Selecting the “Add” button allows the user to add more goals from the report, as well. The drop down within the goal section allows for selecting a “Top Problem”, “7 point Likert Goal”, or “Goal Attainment Scaling” to automatically add to the report.
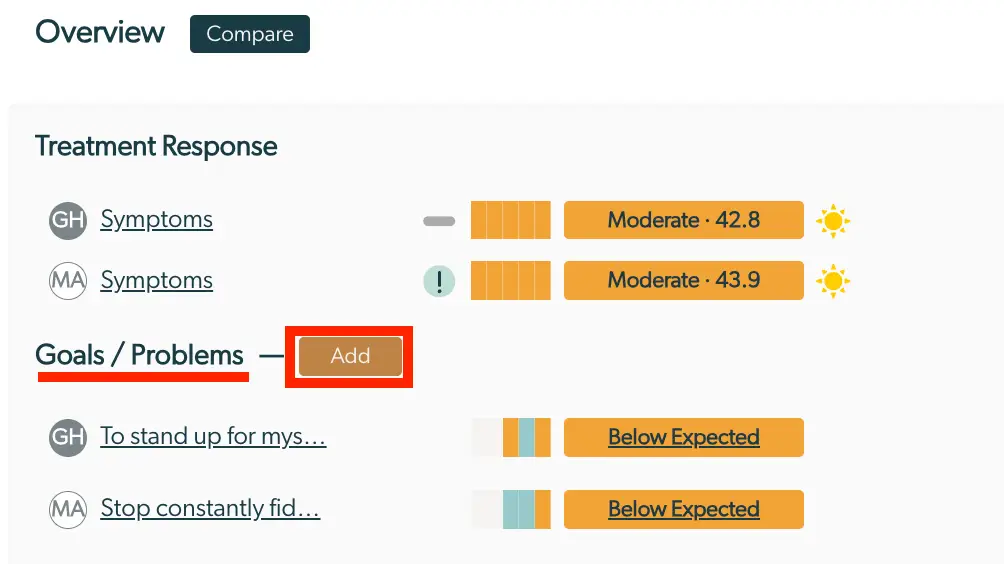
The screenshot displays the Enhanced Feedback Report within the Mirah Measurement-Based Care platform. At the top, there is a navigation option labeled 'Overview' with a button 'Compare' next to it. The report is divided into two sections: 'Treatment Response' and 'Goals / Problems'. In the 'Treatment Response' section, there are two entries labeled 'Symptoms' with initials 'GH' and 'MA' next to them, indicating different users or categories. Each entry has a graphical representation of progress, a textual description 'Moderate' followed by a numerical score (42.8 and 43.9), and a sun icon suggesting positive progress. The 'Goals / Problems' section lists two entries with partial text 'To stand up for mys...' and 'Stop constantly fid...', each associated with initials 'GH' and 'MA'. These entries have graphical progress bars and are marked 'Below Expected' in orange, indicating areas needing improvement. A prominent 'Add' button is located next to 'Goals / Problems', allowing users to add new goals or problems.

Other Scales

The bottom section of the left panel presents the information related to the rest of the scales from the respondents. Scales are grouped by domains that organize scales measuring similar psychometric constructs. The names shown in the report are typically the construct names. However, when selecting a scale to view the details, the scale name is also displayed.

Deeplinking​

The enhanced feedback report supports deeplinking.

Interpreting the Enhanced Clinical Feedback Report​

Overview Panel

The “Overview” Panel has common elements for all scales administered. This includes who responded, what is being measured, trend over time, a heatmap indicating the change over time, the current/most recent score, and any acute changes in the scale since the last session. Each section below explains one of these common elements and how to use them to interpret the report.
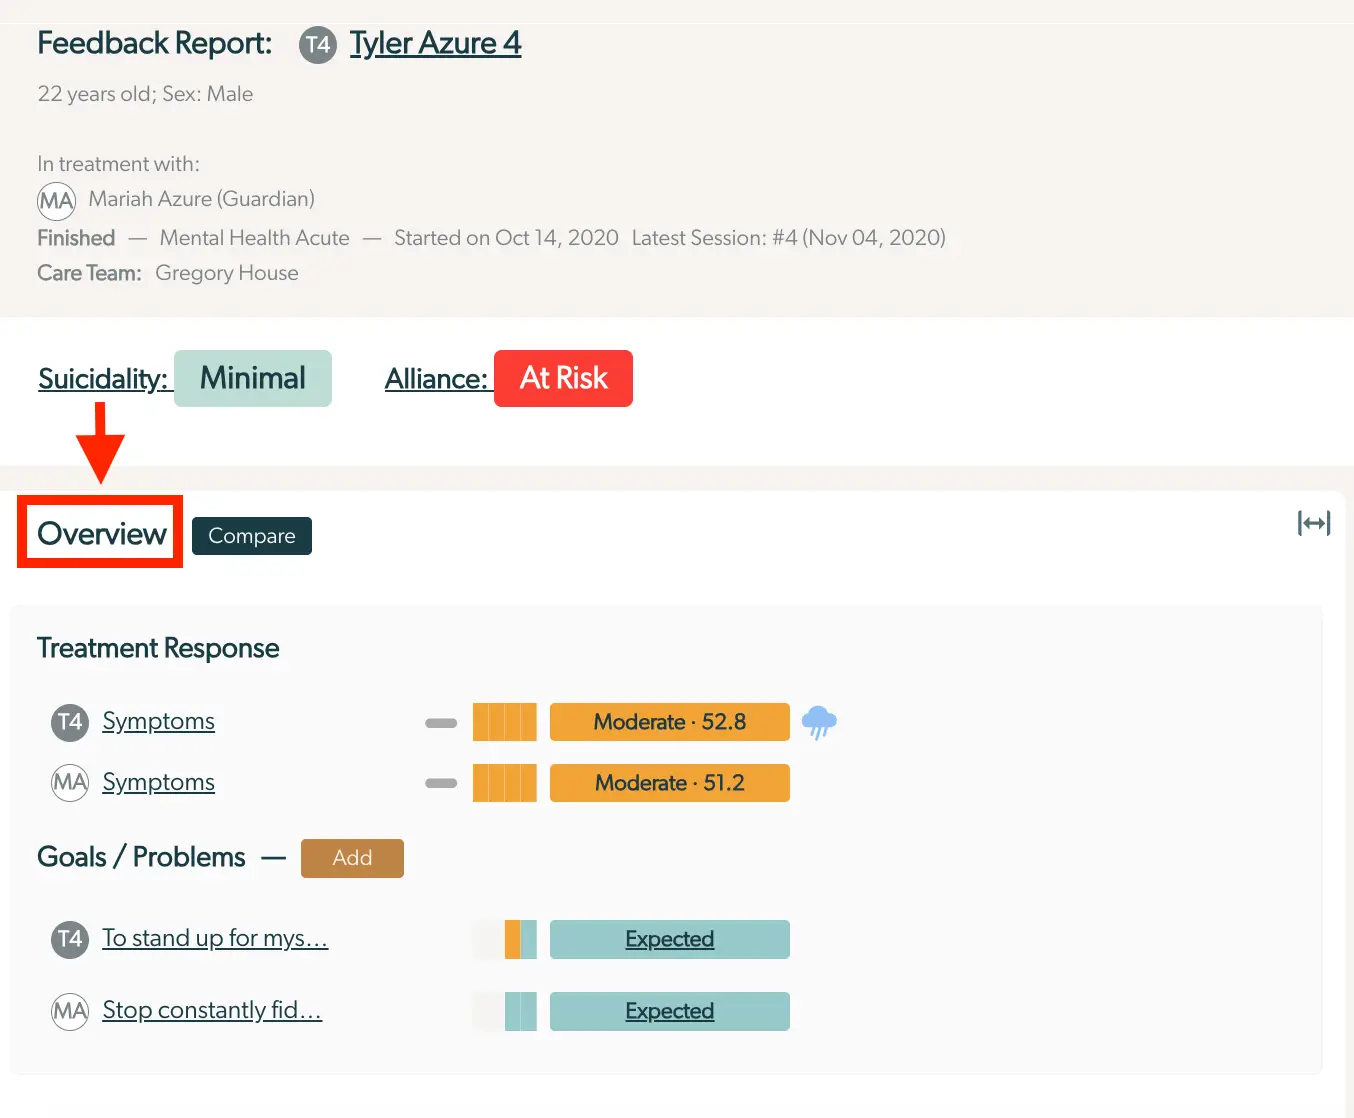
The screenshot displays the Enhanced Feedback Report for a patient named Tyler Azure, aged 22, male. The report indicates that Tyler is in treatment with Mariah Azure (Guardian) and the care team includes Gregory House. The treatment is marked as finished under 'Mental Health Acute', with the latest session being session #4 on November 4, 2020. The report highlights two key metrics: Suicidality, marked as 'Minimal', and Alliance, marked as 'At Risk'. Below these metrics, there are two tabs labeled 'Overview' and 'Compare', with 'Overview' being selected. The 'Treatment Response' section shows symptom scores for Tyler and Mariah Azure, both marked as 'Moderate' with scores of 52.8 and 51.2 respectively. The 'Goals / Problems' section lists goals for both Tyler and Mariah Azure, with both goals marked as 'Expected'. The 'Add' button is located next to the 'Goals / Problems' section, allowing users to add new goals or problems.

Trend

The trend over time icon appears for any measure that has three or more completed sessions. It indicates that the patient has been “Improving”, “Stable”, or “Worsening” over time since the measure was first completed. Hovering over the icon gives a text explanation of its meaning, for additional clarification. If there is no trend icon, the measure does not support trends and additional exploration can provide further details.
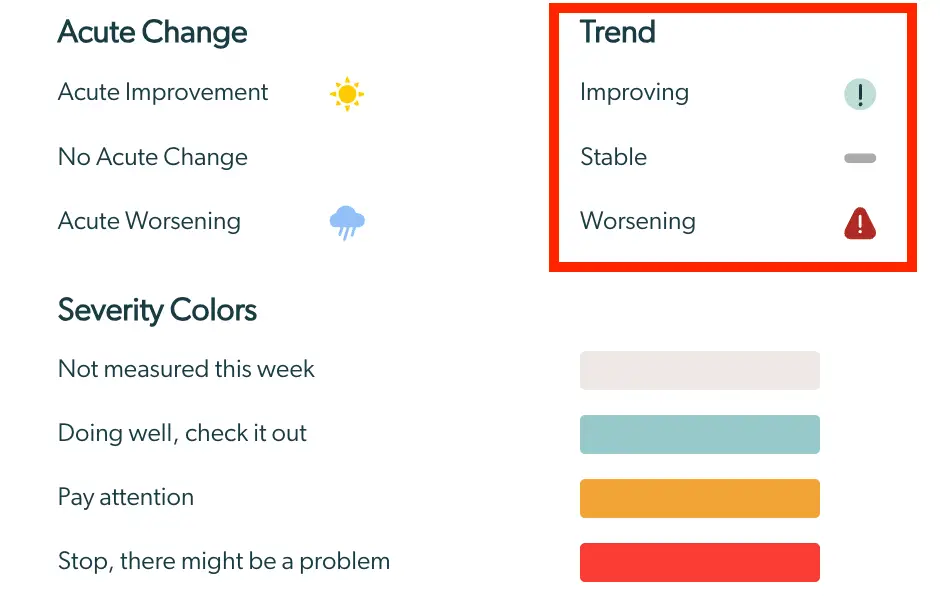
The screenshot displays a section of the Enhanced Feedback Report in Mirah Measurement-Based Care. It is divided into two main categories: Acute Change and Severity Colors. The Acute Change section includes three states: Acute Improvement, represented by a sun icon, No Acute Change, represented by a cloud icon, and Acute Worsening, represented by a rain cloud icon. The Severity Colors section lists four conditions: Not measured this week, Doing well, check it out, Pay attention, and Stop, there might be a problem, each associated with a specific color block. On the right side, there is a Trend box highlighted in red, showing three trend statuses: Improving with a green exclamation mark icon, Stable with a gray line icon, and Worsening with a red exclamation mark icon. This screen helps users interpret patient progress and severity levels based on visual indicators.

In the examples below, the client report of “Life Satisfaction” is stable, which means there has been no change since the first time the measure was completed. In other words, there might be some small differences in the responses to the measure at each time, but those differences were not significant. “Therapy Alliance”, however, shows an improving trend icon. This may mean that the symptoms are getting better or perhaps there is less awareness of the symptoms (and therefore less endorsement of symptoms) since the first administration of the measure.
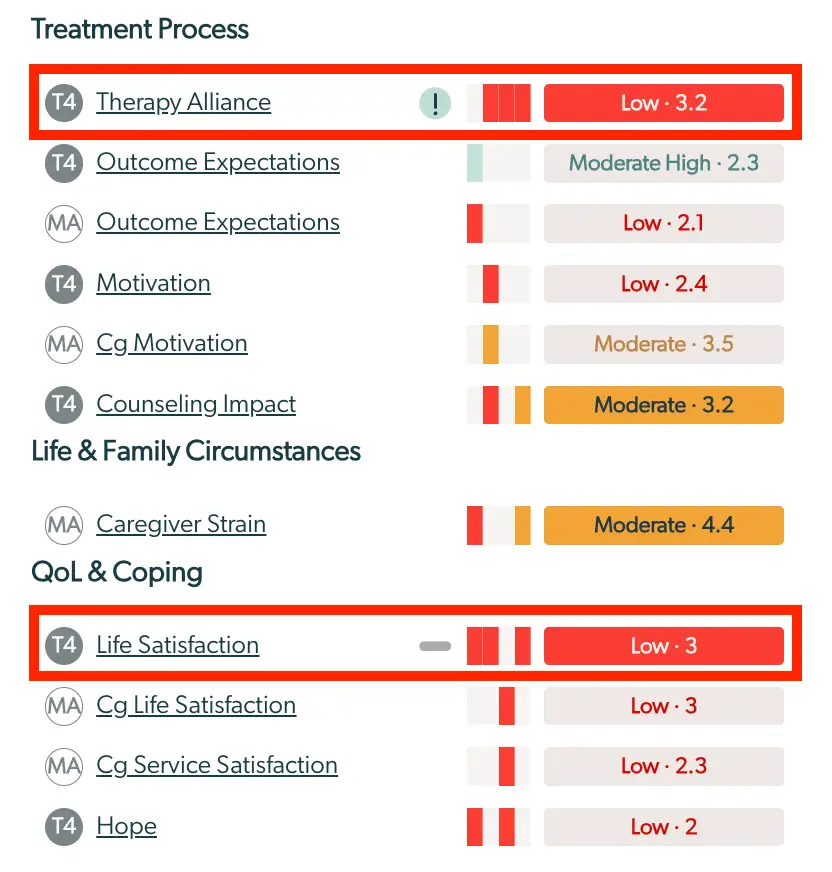
The screenshot displays the Enhanced Feedback Report, which is part of the Mirah Measurement-Based Care platform. It is divided into sections labeled 'Treatment Process,' 'Life & Family Circumstances,' and 'QoL & Coping.' Each section lists various metrics such as 'Therapy Alliance,' 'Outcome Expectations,' 'Motivation,' 'Counseling Impact,' 'Caregiver Strain,' 'Life Satisfaction,' 'Cg Life Satisfaction,' 'Cg Service Satisfaction,' and 'Hope.' Each metric is accompanied by a visual indicator of performance, represented by colored bars, and a textual rating such as 'Low,' 'Moderate,' or 'Moderate High,' followed by a numerical score. The 'Therapy Alliance' and 'Life Satisfaction' metrics are highlighted with a red border, indicating a low score of 3.2 and 3, respectively. The colored bars provide a quick visual representation of the score, with red indicating low performance. The purpose of this screen is to provide insights into various aspects of care delivery and patient satisfaction, allowing providers to identify areas needing improvement.

Heatmap: Change Over Time

The heatmap for a measure appears inline following the indication of the respondent and what is being measured. Each heatmap is made up of colored chips that show all of the past responses for that respondent on the measure over the course of time. This is a useful guide to see the past scores on that measure all at once and the change over the course of time. The image to the right shows the heatmap with responses at every session, with gaps in administration (i.e. specific sessions were not scheduled to administer this measure), and with gaps in patient response (i.e. the measure was administered but the respondent did not answer at all or with enough responses to be clinically significant).

The heatmap noting responses at every session shows a worsening trend over the course of treatment, where a client started out in the low range and then over the course of a few sessions worsened and is now reporting scores in the moderate range.

Badge: Current Score

The most recent score for a measure appears as a badge inline following the heatmap. The badge color and the text both carry meaning.
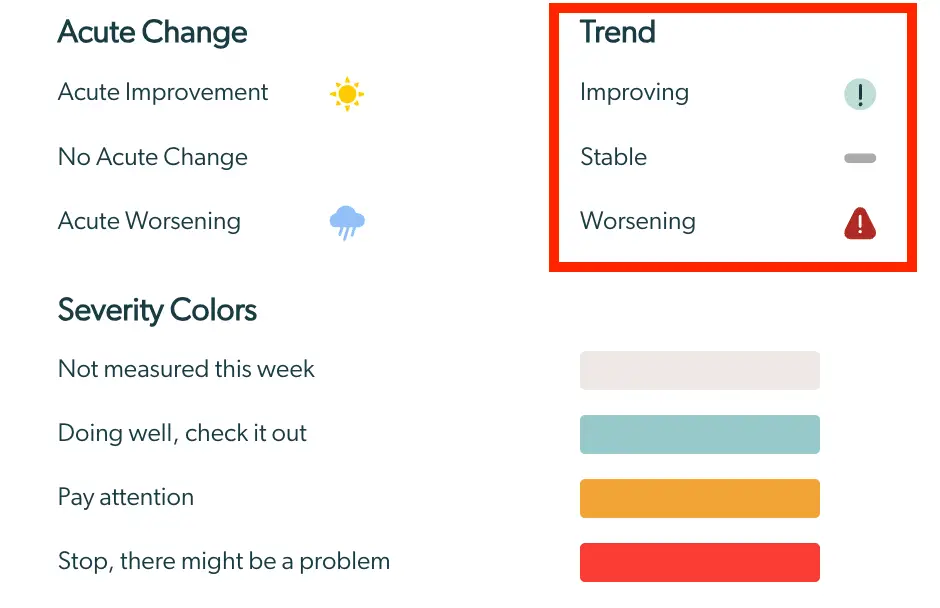
The screenshot displays a section of the Enhanced Feedback Report in Mirah Measurement-Based Care. It is divided into two main categories: 'Acute Change' and 'Trend'. The 'Acute Change' section includes three states: Acute Improvement, represented by a sun icon; No Acute Change, represented by a cloud icon; and Acute Worsening, represented by a rain cloud icon. The 'Trend' section, highlighted in red, shows three possible states: Improving, marked by a green exclamation icon; Stable, marked by a gray dash icon; and Worsening, marked by a red exclamation icon. Below these sections, 'Severity Colors' are displayed, indicating different levels of concern: Not measured this week (light gray), Doing well, check it out (teal), Pay attention (orange), and Stop, there might be a problem (red). These colors help users quickly assess the status of care delivery and patient progress.

Color

The color of the current score badge and throughout the report correspond to a stoplight, where green represents “Doing well, check it out”, yellow represents the need to pause and “Pay attention”, and red indicates the clinician should “Stop, there might be a problem).

If the badge is gray, it indicates that the measure was not administered at the most recent session, based on how often it is scheduled to be administered. In this case, the text color and the heatmap provide insight into the measure’s responses the last time it was administered and responses were collected.
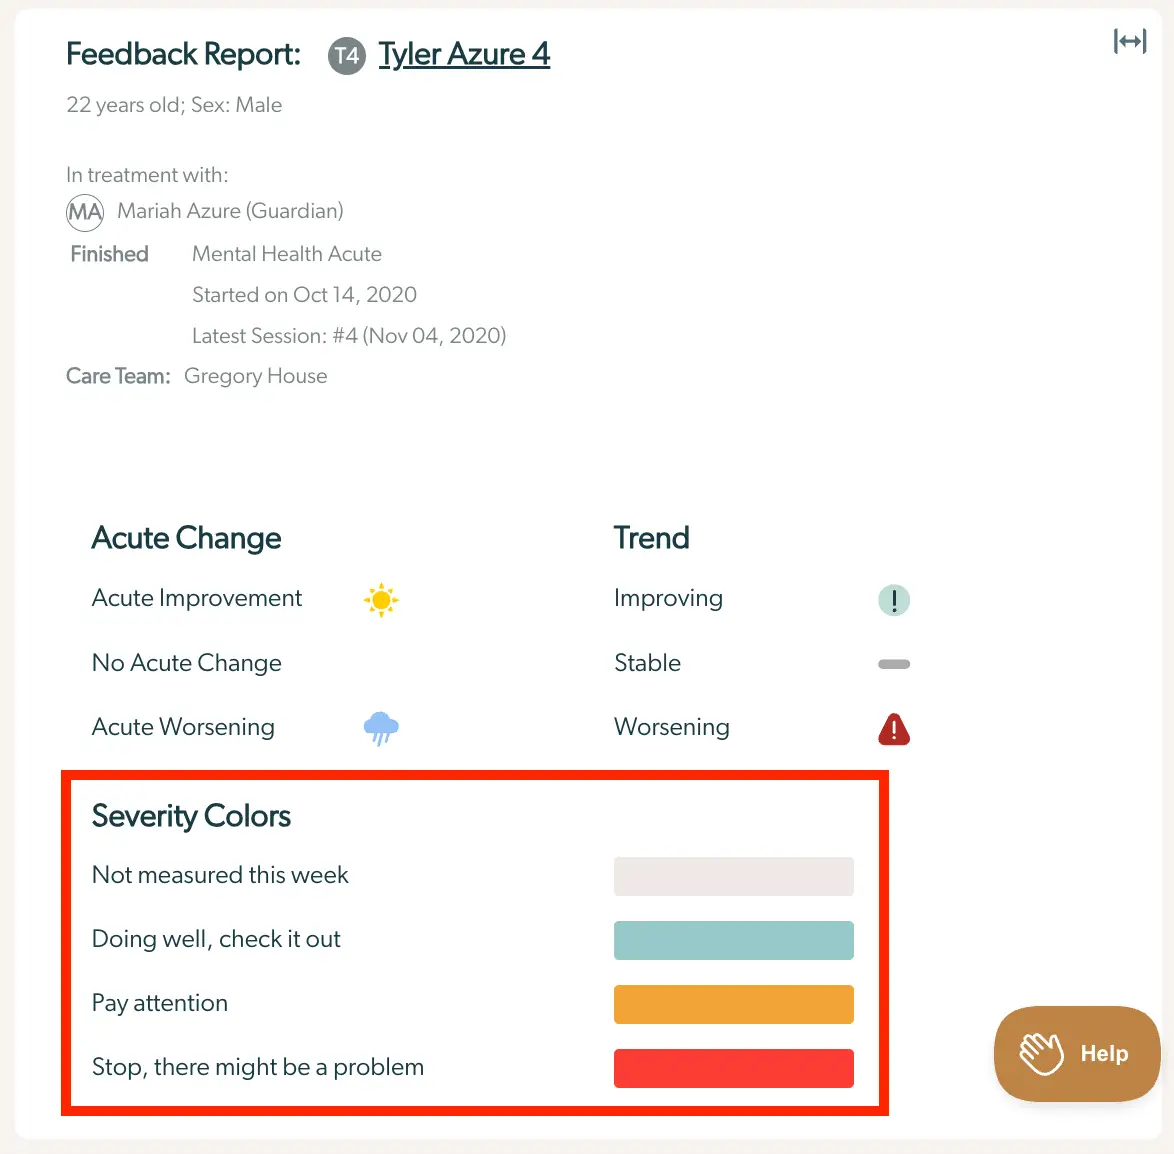
The screenshot displays the Enhanced Feedback Report for a patient named Tyler Azure, who is 22 years old and male. The report indicates that Tyler is in treatment with Mariah Azure, his guardian, for Mental Health Acute care, which started on October 14, 2020, with the latest session being number 4 on November 4, 2020. The care team includes Gregory House. The report is divided into sections: 'Acute Change' and 'Trend'. 'Acute Change' includes options for Acute Improvement, No Acute Change, and Acute Worsening, each represented by icons. 'Trend' shows the patient's progress as Improving, Stable, or Worsening, with corresponding icons. Below these sections, there is a 'Severity Colors' legend explaining the color codes used in the report: gray for not measured this week, teal for doing well, orange for pay attention, and red for stop, there might be a problem. The 'Help' button is located at the bottom right corner of the screen.

The full color palette through the report corresponds to shades of these 4 colors, based on the level of severity that is represented. This is seen both on the badges and also in the heatmaps, based on the measure and the responses that are available.

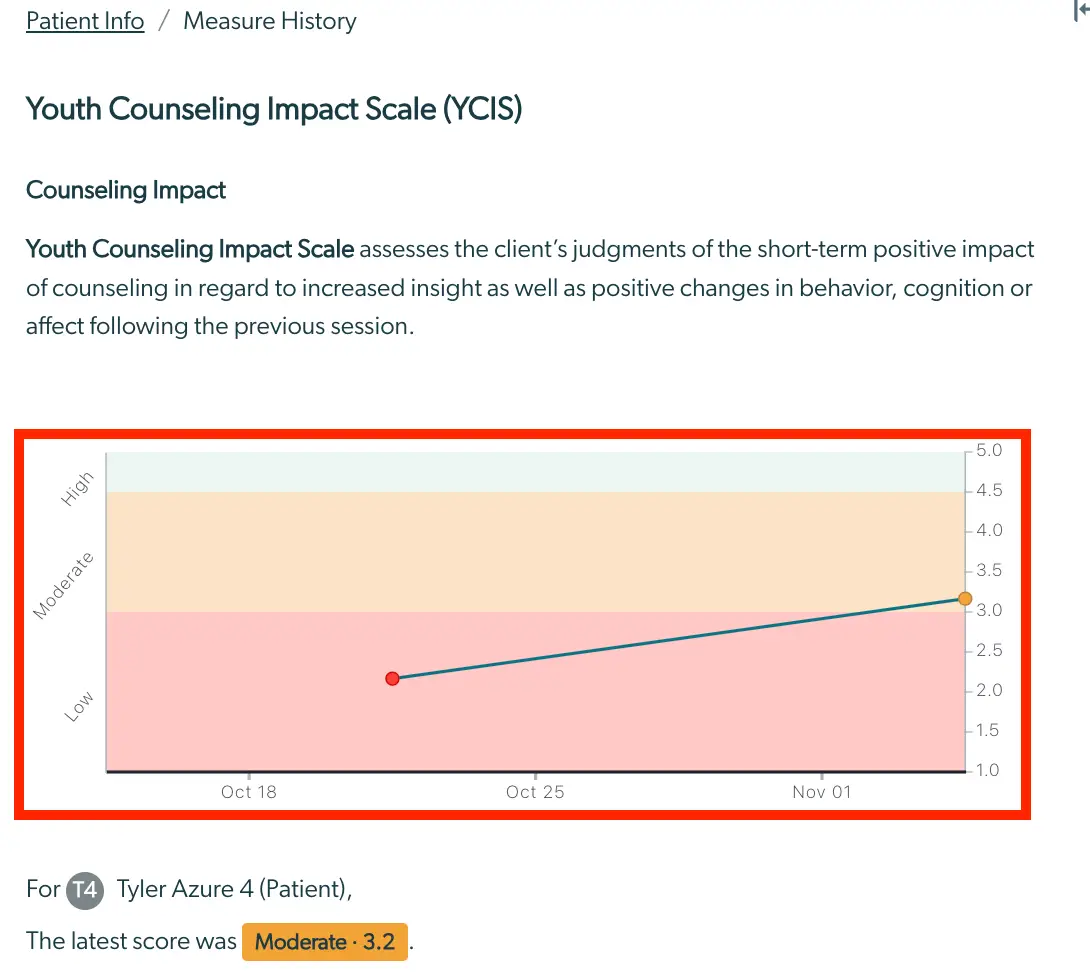
The screenshot displays a section of the Enhanced Feedback Report focusing on Counseling Impact. It features a label 'T4' indicating the task or section number, followed by the text 'Counseling Impact' which signifies the area being evaluated. Next to it, there is a red arrow pointing towards a bar graph icon, which visually represents the impact level. The bar graph is followed by a colored box with the text 'Moderate · 3.2', indicating the impact level and score. This section helps users understand the effectiveness of counseling efforts within the report.The screenshot displays the Youth Counseling Impact Scale (YCIS) section of the Enhanced Feedback Report, which assesses the client's judgments of the short-term positive impact of counseling. The page is part of the Measure History under Patient Info. It includes a graph that visually represents the counseling impact over time, with a scale from Low to High on the vertical axis and dates on the horizontal axis. The graph shows a trend line indicating the client's progress, with data points marked for specific dates: October 18, October 25, and November 1. Below the graph, there is a summary indicating that for the patient Tyler Azure 4, the latest score was Moderate at 3.2. This score is highlighted in orange to emphasize the current assessment level.

Text

The text within the badge corresponds to the measure itself. A low score on some measures is in the positive range while on others, it may be in the negative range or indicate higher severity. If the text is just a number or date, it means that the measure does not have clinical cutoffs or carry a score, respectively. In this case, going directly to the item responses can offer additional clinical insight.
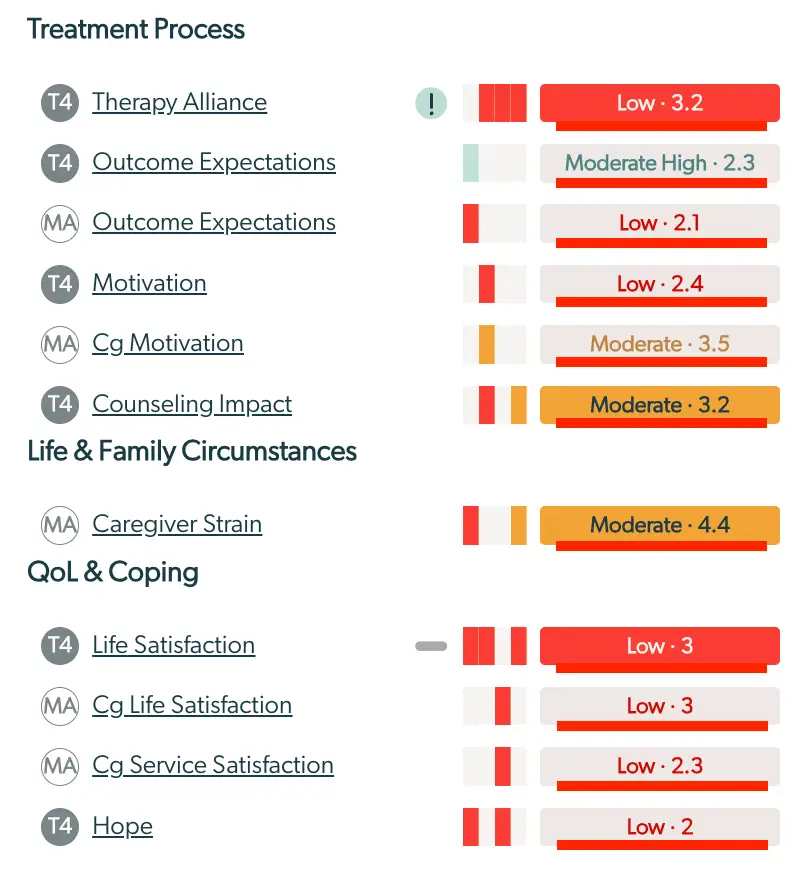
The screenshot displays the Enhanced Feedback Report, which is part of the Mirah Measurement-Based Care platform. It is divided into three sections: Treatment Process, Life & Family Circumstances, and QoL & Coping. Each section lists various metrics related to patient care, such as Therapy Alliance, Outcome Expectations, Motivation, Counseling Impact, Caregiver Strain, Life Satisfaction, and Hope. Next to each metric, there is a visual representation of the score using colored bars, indicating the level of concern from low to moderate high. The scores are numerically represented alongside the color-coded bars, with labels such as 'Low' or 'Moderate' followed by a numerical value. The purpose of this screen is to provide a quick visual assessment of different aspects of patient care and satisfaction, aiding healthcare providers in identifying areas that may require attention.

Interpretation

Combining all of the information in a sentence can be helpful for interpreting the current score. In Example #1 below, low therapy alliance means there might be a risk or rupture to your working relationship with a client, which is something to stop and explore. In Example #2, low symptoms mean that symptoms are minimal compared to other clients receiving similar treatment.

The screenshot displays a section of the Enhanced Feedback Report within the Mirah Measurement-Based Care platform. It shows the Therapy Alliance score, which is indicated by a circular icon with 'T3' inside, followed by the text 'Therapy Alliance'. Next to this, there is a visual representation of the score with a color-coded bar, primarily red, indicating a low score. The score is numerically represented as 'Low · 2.8'. This section is part of the report that provides insights into the therapy alliance's effectiveness, helping users understand the current status and areas needing improvement.The screenshot displays a section of the Enhanced Feedback Report focusing on symptoms. It includes a circular icon labeled 'T7' followed by the word 'Symptoms' indicating the category being assessed. Next to it is an exclamation mark icon within a circle, suggesting attention or importance. A horizontal bar graph is shown with several orange segments, visually representing the symptom severity. To the right of the bar graph, a label reads 'Low · 40.6', indicating the symptom severity level and its numerical score. This section helps users understand the current status of symptoms in the context of measurement-based care.

Acute Change

Acute change compares the most recent score on a measure to the previous administration, to help the clinician understand whether a change in score is significant or not. When there has been an acute change since the previous administration, an acute change icon will be present. This icon represents that the change was large enough to reach a specified threshold (which varies by scale).
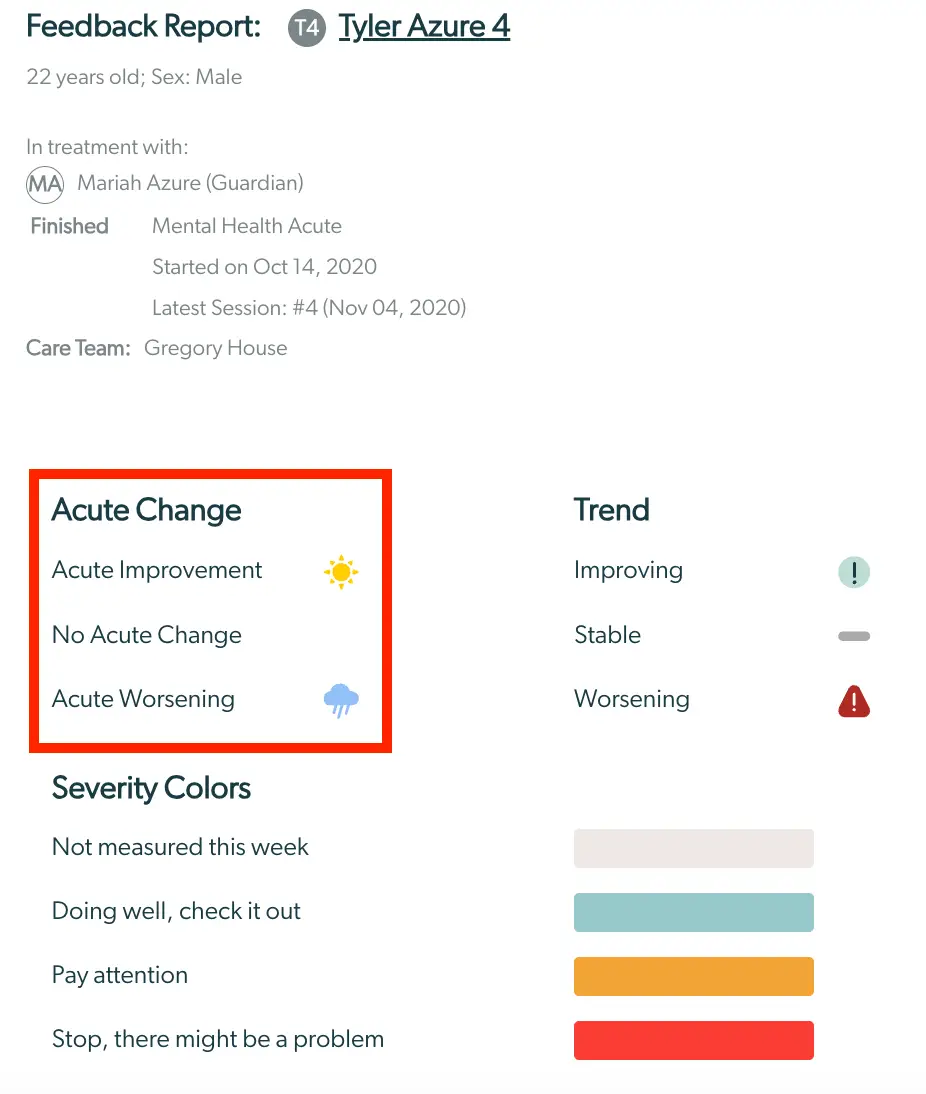
The screenshot displays an Enhanced Feedback Report for a patient named Tyler Azure, aged 22, male. The report is part of the measurement-based care process and provides insights into the patient's treatment progress. It includes the patient's treatment details, such as the guardian Mariah Azure, the mental health acute program, and the care team led by Gregory House. The report highlights the 'Acute Change' section, indicating the patient's current status with options for Acute Improvement, No Acute Change, and Acute Worsening, each accompanied by respective icons. The 'Trend' section shows the patient's progress trend with options for Improving, Stable, and Worsening, each represented by different icons. The 'Severity Colors' section provides a color-coded guide to interpret the patient's condition, ranging from 'Not measured this week' to 'Stop, there might be a problem.'

Reaching this threshold may be clinically meaningful and indicate recent improvement or worsening over and above any natural variations that may occur. Perhaps there was a recent event in the client’s life, or something else to be explored further in session. Hovering over the icon gives a text explanation of its meaning, for additional clarification. If there is no acute change icon, no acute change for that measure was indicated since the last administration.

In the examples below, the client report of “Symptoms'' was “Moderate” and orange, as an item to pay attention to. However, symptoms have worsened since the last session, as noted by the thundercloud icon.
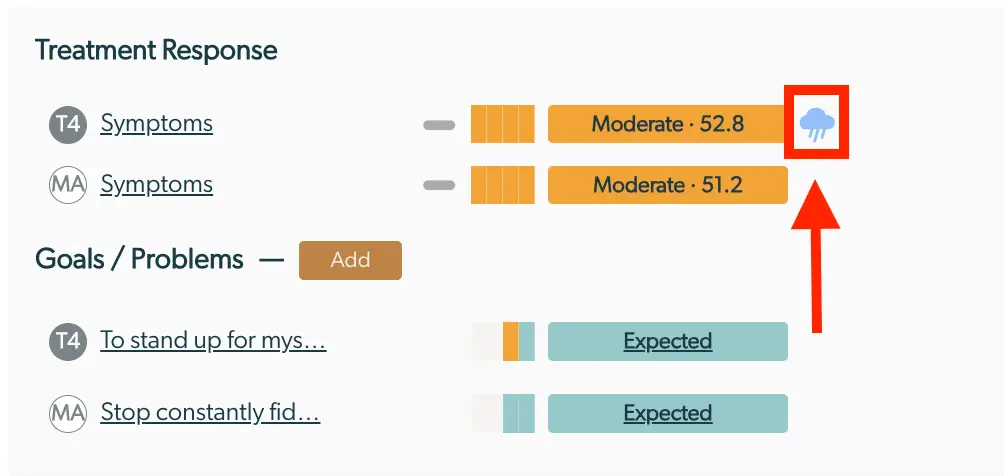
The screenshot displays a section of the Enhanced Feedback Report within the Mirah Measurement-Based Care platform. The screen is divided into two main sections: 'Treatment Response' and 'Goals / Problems'. Under 'Treatment Response', there are two entries labeled 'Symptoms' for T4 and MA, each accompanied by a horizontal bar graph indicating the severity level, marked as 'Moderate' with scores of 52.8 and 51.2 respectively. Next to these scores, there is a weather icon, suggesting a visual representation of the treatment response. The 'Goals / Problems' section lists two goals, 'To stand up for mys...' and 'Stop constantly fid...', each associated with T4 and MA respectively, and marked as 'Expected'. There is an 'Add' button located next to 'Goals / Problems', allowing users to add new goals or problems. The interface is designed to provide a quick overview of treatment responses and goal expectations, facilitating collaborative care and clinical progress tracking.

Details Panel

If there are points in the overview that require further understanding and exploration, all of the heatmaps and badges are clickable. Once an overview item has been clicked, an outline appears around the line item to orient the clinician to what they are viewing in the “Details” panel.
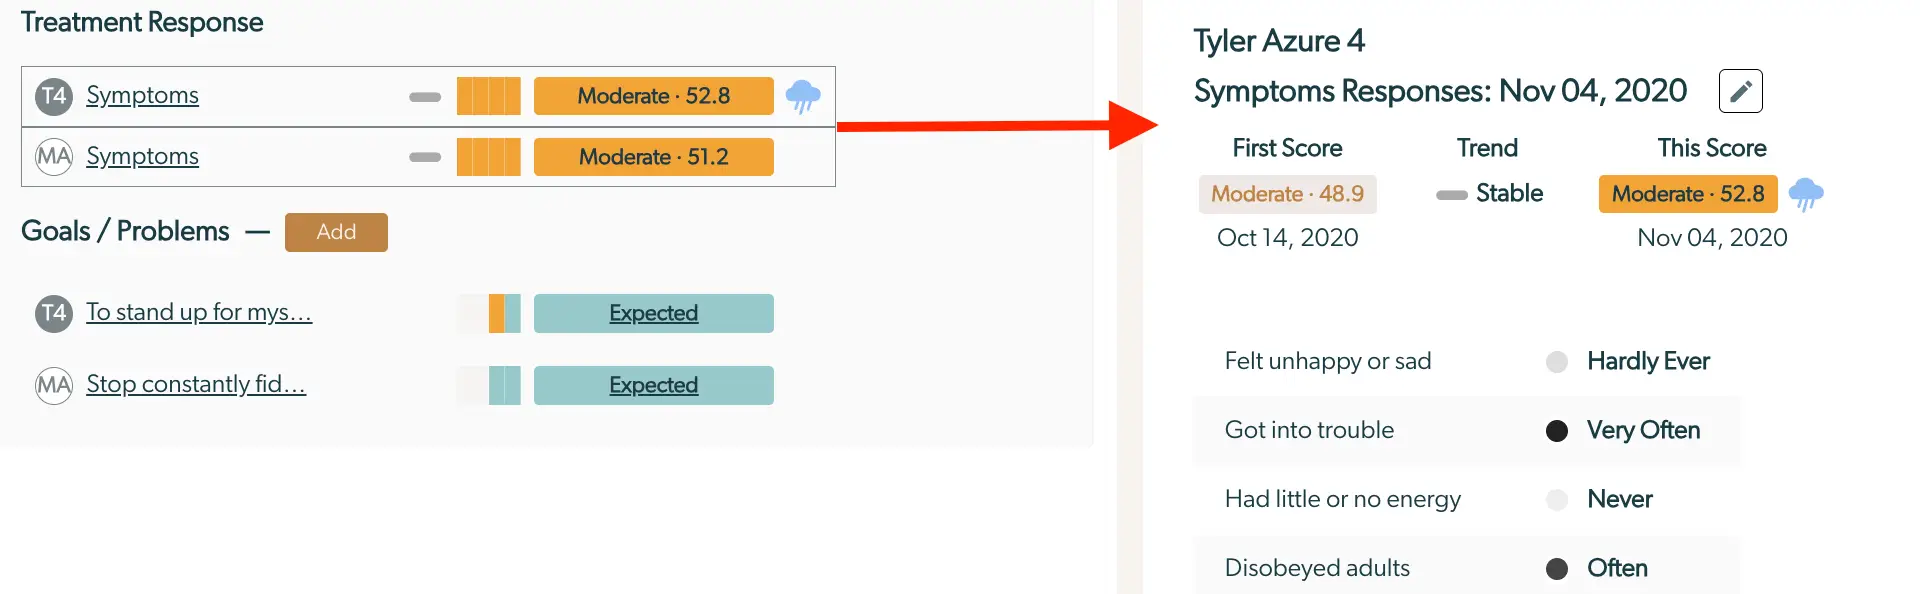
The screenshot displays the Enhanced Feedback Report feature of Mirah Measurement-Based Care. On the left side, under 'Treatment Response', there are two entries labeled 'Symptoms' with scores indicating a moderate response, 52.8 and 51.2 respectively. Each entry has a visual representation of the score and a weather icon suggesting the mood or condition. Below, under 'Goals / Problems', there are two goals listed with abbreviated titles, each with a progress bar and a link labeled 'Expected'. The 'Add' button is located next to 'Goals / Problems' for adding new entries. On the right side, the report for 'Tyler Azure 4' dated Nov 04, 2020, shows the 'First Score' as moderate at 48.9 from Oct 14, 2020, and 'This Score' as moderate at 52.8 with a stable trend. Below, there are symptom responses with frequency indicators such as 'Hardly Ever', 'Very Often', 'Never', and 'Often'. An edit icon is present next to the date for making changes.

Scale Name and Heatmap Details

Selecting the scale name or the heatmap from the “Overview” panel opens a graphical representation of all administered scale scores in the “Details” panel. At the top of the right “Details” panel, there is a navigation trail to indicate this is the “Measure History”. It includes the name of the measure, a brief description of the measure, each past response presented in a line graph, a reminder of the respondent for the measure that is being viewed, and the latest score on the measure.
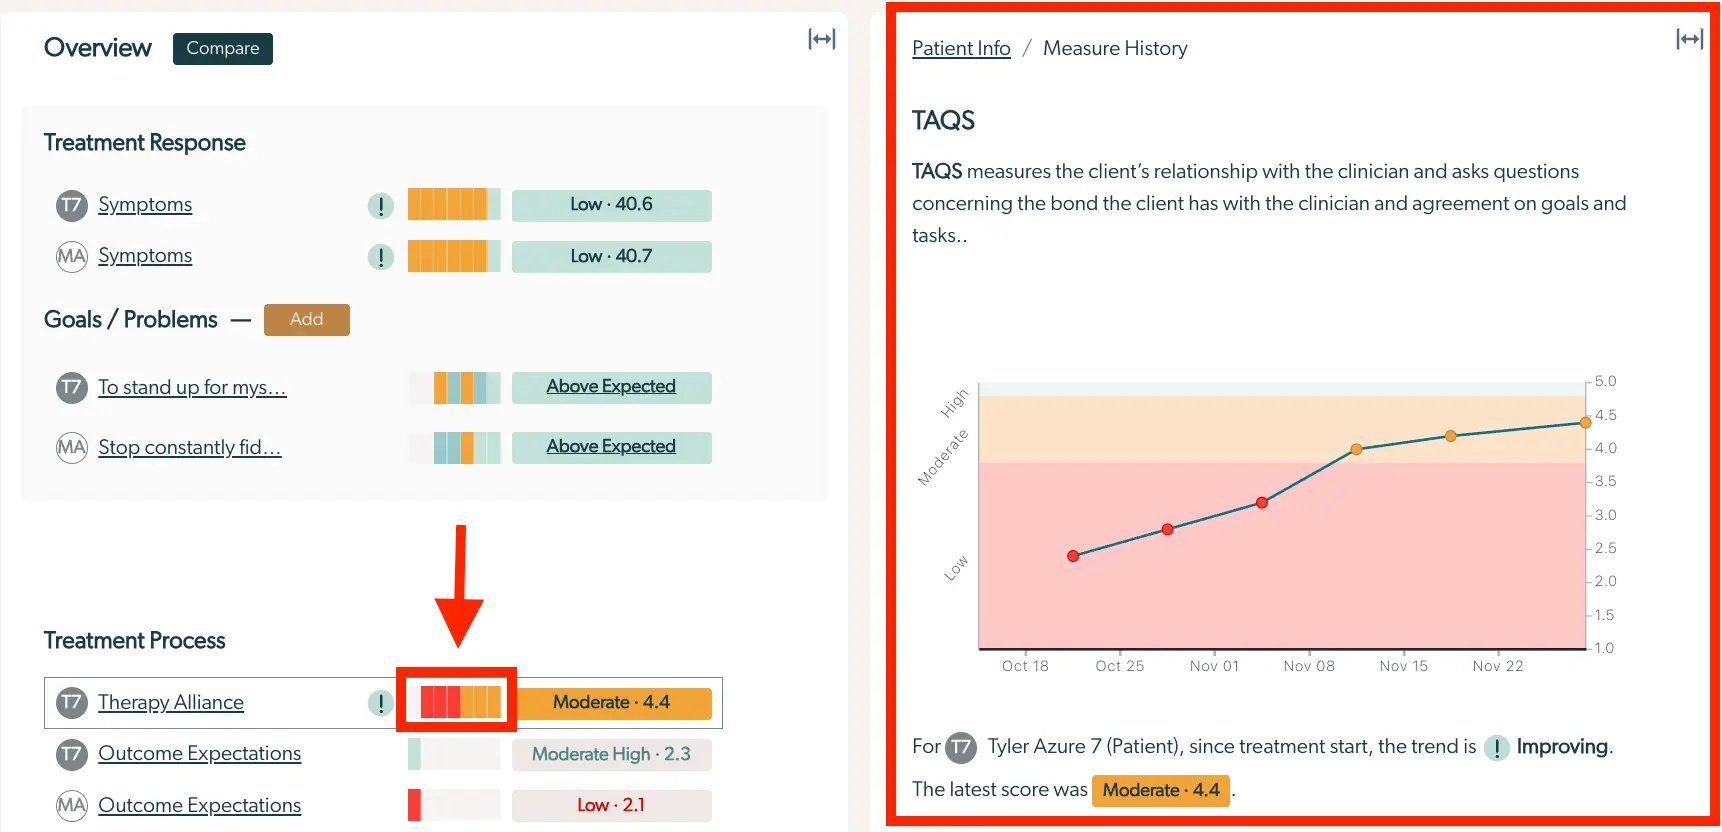
The screenshot displays the Enhanced Feedback Report within the Mirah Measurement-Based Care platform. On the left side, under the 'Overview' section, users can see the 'Treatment Response' and 'Goals/Problems' areas. 'Treatment Response' includes two entries labeled 'Symptoms' with scores of 40.6 and 40.7, both marked as 'Low'. The 'Goals/Problems' section lists two goals: 'To stand up for myself' and 'Stop constantly fiddling', both marked as 'Above Expected'. Below these sections is 'Treatment Process', which includes 'Therapy Alliance' with a score of 4.4 marked as 'Moderate', 'Outcome Expectations' with scores of 2.3 and 2.1 marked as 'Moderate High' and 'Low' respectively. On the right side, the 'Patient Info / Measure History' section provides details about TAQS, which measures the client's relationship with the clinician. A graph shows the trend of the 'Therapy Alliance' score over time, indicating improvement. The latest score is highlighted as 'Moderate 4.4'. The 'Compare' button is located at the top left of the 'Overview' section.

Hovering over the latest score gives additional details on the score including the date it was recorded, the exact score, and the severity that score corresponds to. As a reminder, this information is also available within the badge for the measure, in the “Overview” panel.
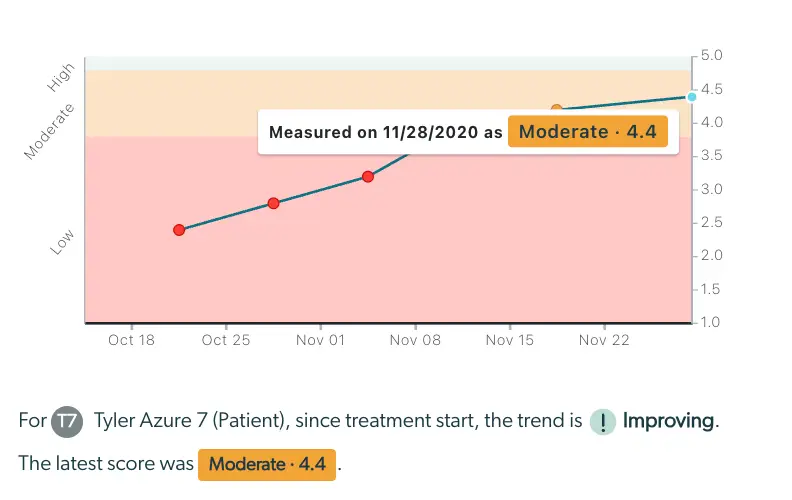
The screenshot displays a line graph representing the progress of a patient's treatment over time, specifically from October 18 to November 28. The graph is divided into three colored sections indicating different levels of measurement: Low, Moderate, and High. The line graph shows data points marked with red dots, each representing a measurement taken on specific dates. A tooltip is visible, highlighting the measurement taken on November 28, 2020, with a score of 4.4, categorized as Moderate. Below the graph, there is a textual summary stating that for patient Tyler Azure 7, the trend since the start of treatment is improving, with the latest score being Moderate at 4.4. The text includes an icon indicating improvement and emphasizes the latest score in a highlighted box.

Within “Measure History” data points on the graph as well as the latest score can both be selected to show the individual item responses for the corresponding scale administration (see below).

Badge Details: Responses

Selecting the current score badge from the “Overview” panel opens the detailed, item level responses for the most recent administration of that measure. At the top of the “Details” panel, the navigation trail indicates this is the “Responses” view.

This view confirms the name of the respondent, the response date, and then outlines the first score that was ever recorded for the measure, any trend that exists for the measure, and the score that is currently being viewed. Additionally, the pencil icon allows the user to navigate and edit any of the responses that are documented. Following these details, each item on the scale is written with the correlating responses.
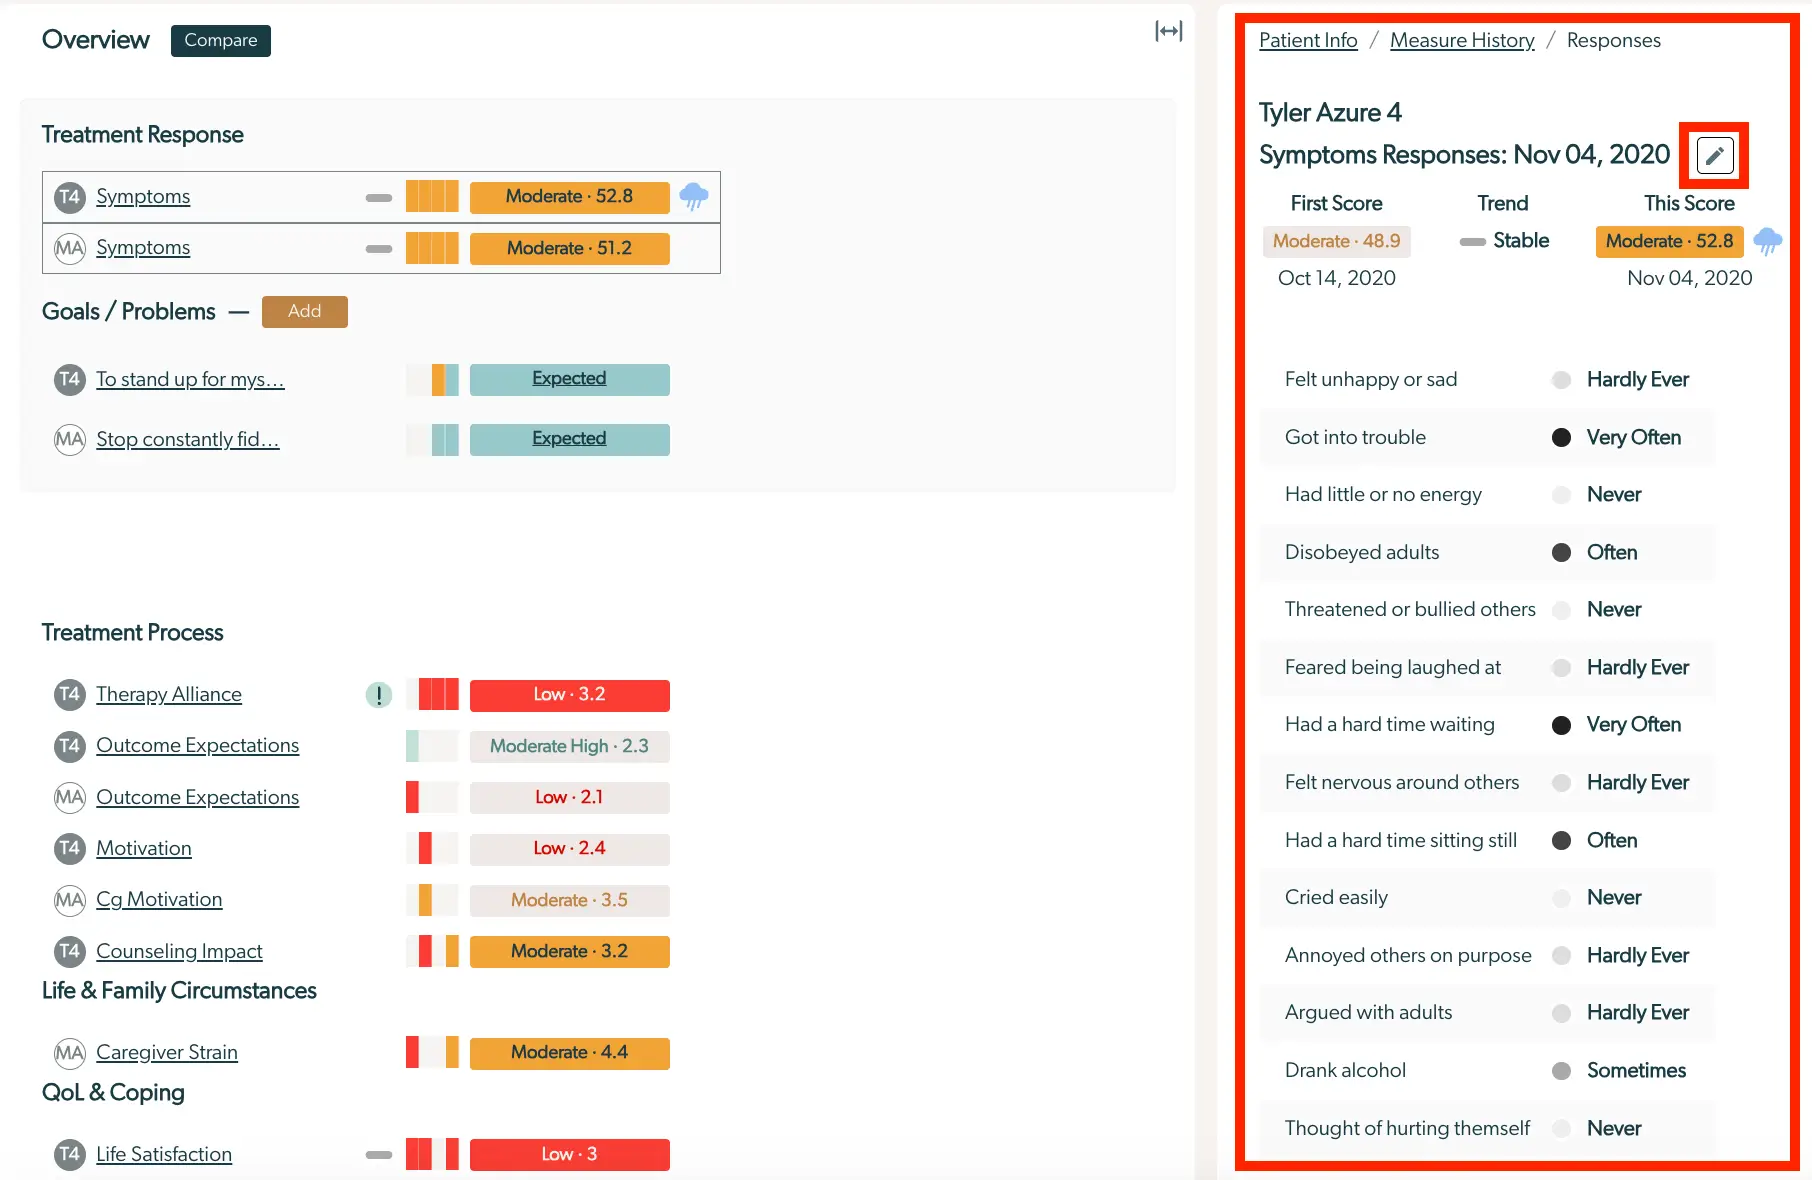
The screenshot displays the Enhanced Feedback Report for a patient named Tyler Azure, dated November 4, 2020. On the left side, the screen is divided into sections: Treatment Response, Goals/Problems, Treatment Process, Life & Family Circumstances, and QoL & Coping. Each section lists various metrics with corresponding scores and indicators of severity, such as 'Moderate', 'Low', and 'Expected'. The right side of the screen shows detailed symptom responses for Tyler Azure, comparing the first score from October 14, 2020, with the current score from November 4, 2020, indicating a stable trend. Each symptom is listed with a frequency indicator, such as 'Hardly Ever', 'Very Often', and 'Never'. The edit button, located at the top right of the symptom responses section, allows users to modify the report details.

If applicable based on the scale, item alerts will be shown for each response with a red dot. This means that the answer given was in the top 25th percentile of negative responses in comparison to the psychometric sample.

Navigating back to the “Measure History”, other item level responses from different scale administrations may be viewed by selecting a data point on the graph or clicking on the latest score.

Additionally, the detailed item responses are populated when any of the risks in the top section are selected.
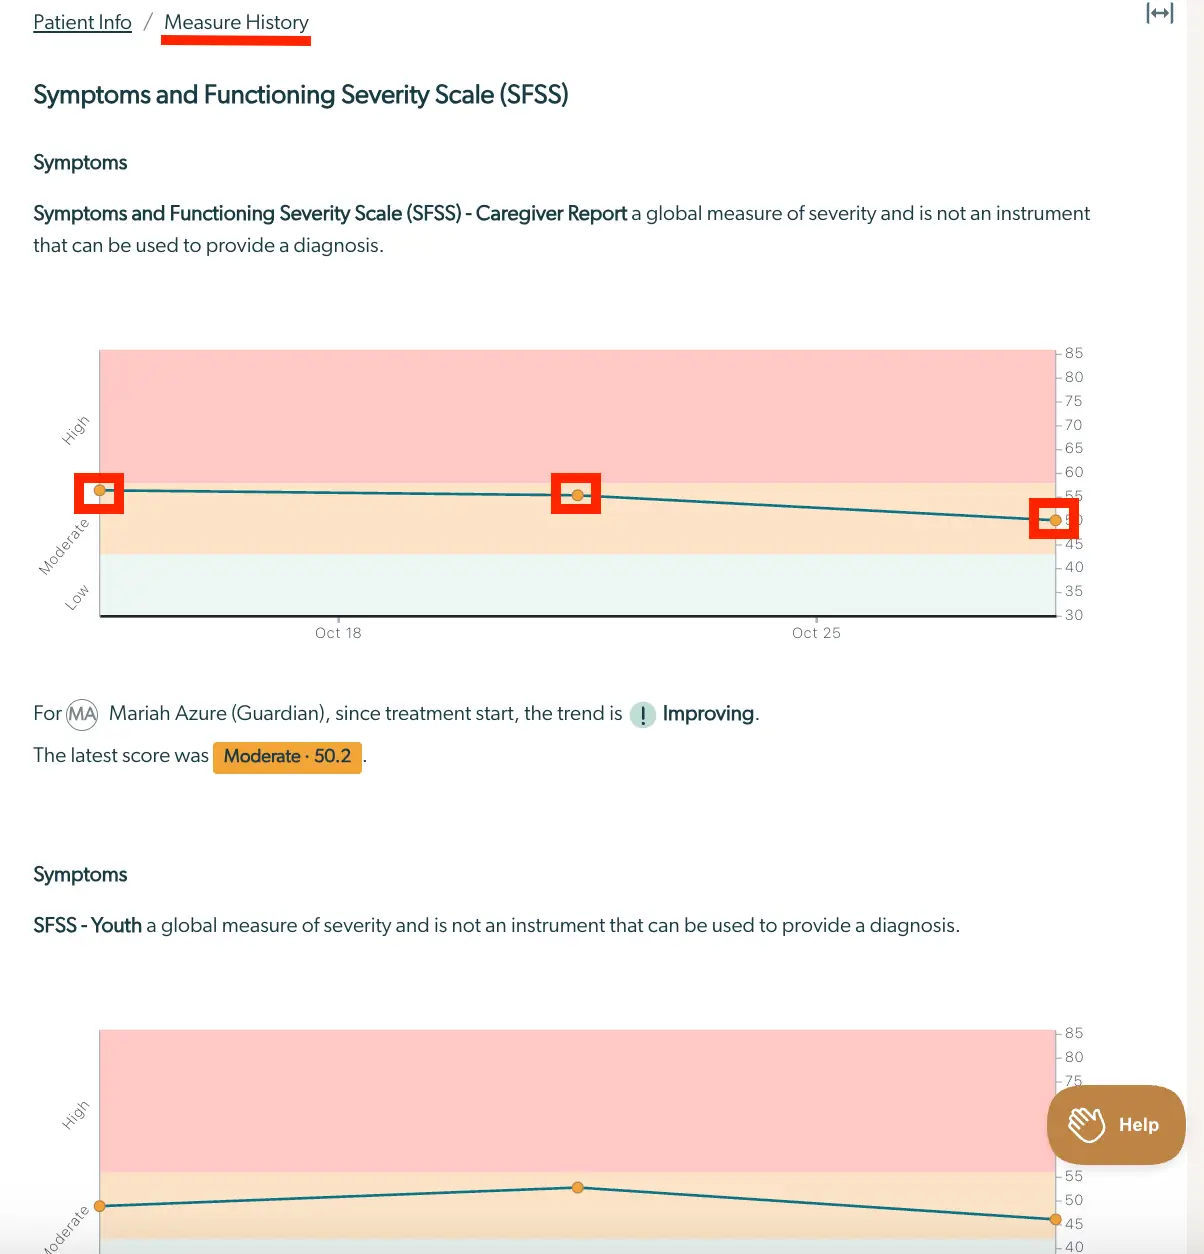
The screenshot displays the Enhanced Feedback Report for the Symptoms and Functioning Severity Scale (SFSS) within the Measure History section. It includes a graph showing the trend of severity scores over time, with a line indicating the progression from October 18 to October 25. The graph is color-coded to represent different severity levels: High, Moderate, and Low. Below the graph, there is a summary for Mariah Azure (Guardian), indicating that since treatment start, the trend is improving, with the latest score being Moderate at 50.2. The page also includes a section for SFSS - Youth, with a similar graph layout. A Help button is located at the bottom right corner of the screen.

Navigating to Different Scales

At any time, details for a different scale can be viewed in the “Details” panel by selecting it from the “Overview” panel. Navigating among the scales will change the indicator box in the “Overview” panel, so the user is always oriented to the scale for which they are viewing the details.

Generate a Clinical Note

Within the Enhanced Feedback Report, users have the ability to view a clinical note with a summary of the report's findings.

1.) Click on the menu in the top right corner and select "Generate Clinical Report".
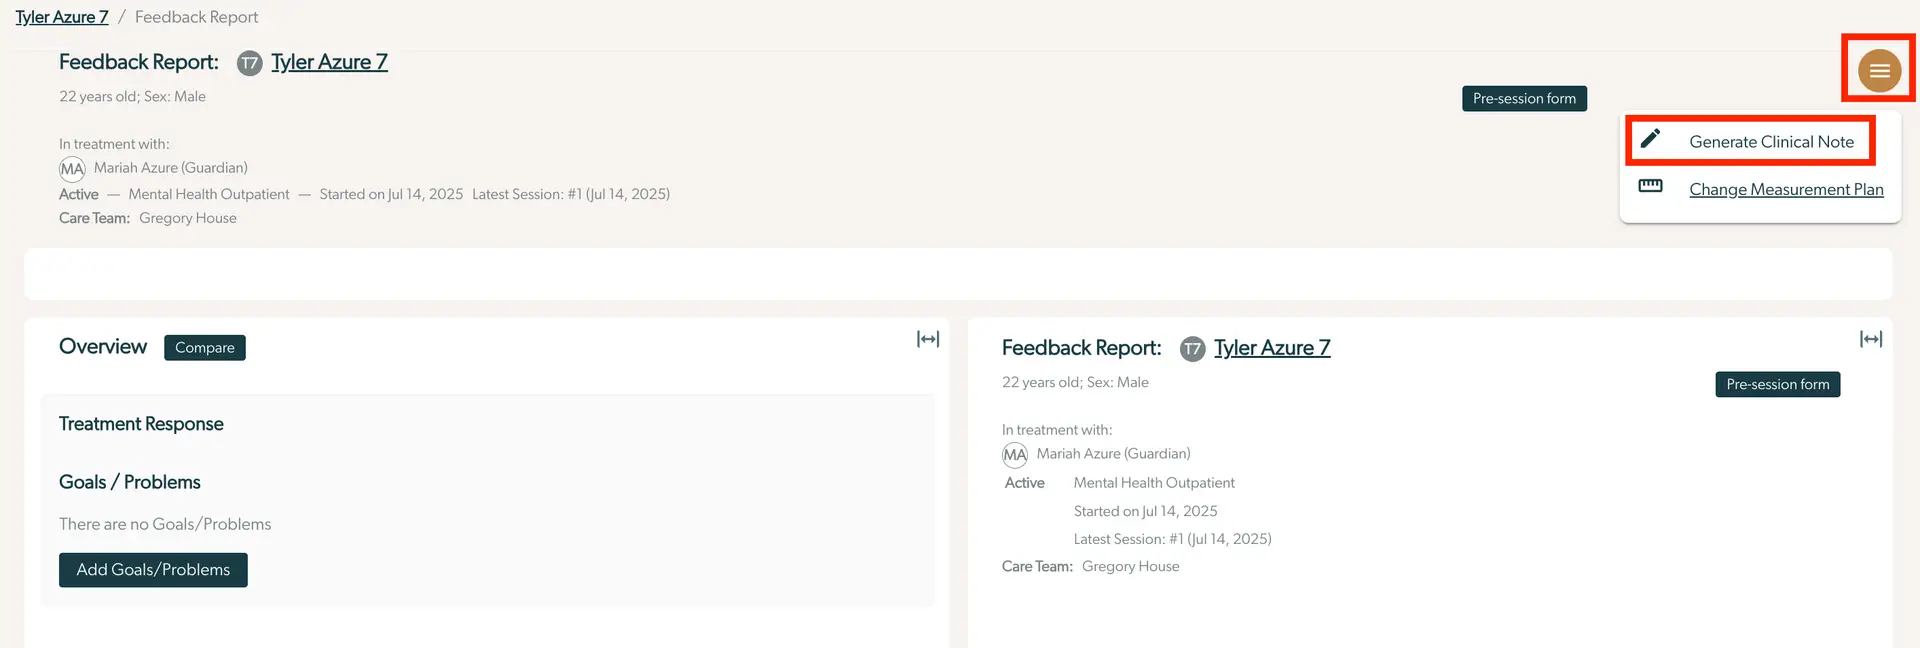
The screenshot displays the Enhanced Feedback Report for a patient named Tyler Azure, aged 22, male. The report is part of the Mirah Measurement-Based Care system. At the top, the breadcrumb navigation shows 'Tyler Azure 7 / Feedback Report'. The report includes details about Tyler's treatment, indicating he is in treatment with Mariah Azure, his guardian, under the care of Gregory House. The treatment is active in the Mental Health Outpatient program, which started on July 14, 2025, with the latest session being session #1 on the same date. On the right side, there is a menu button represented by three horizontal lines, which when clicked, reveals options to 'Generate Clinical Note' and 'Change Measurement Plan'. Below, the 'Overview' section is visible with a 'Compare' button next to it. The 'Treatment Response' and 'Goals / Problems' sections are shown, with a note stating there are no goals/problems currently listed. A button labeled 'Add Goals/Problems' is available for adding new entries. A 'Pre-session form' button is located on the right side of the 'Overview' section.

2.) The note will appear on the screen, detailing important information about the session and measurement responses. By selecting "Copy", this summary will be copied to your clipboard.
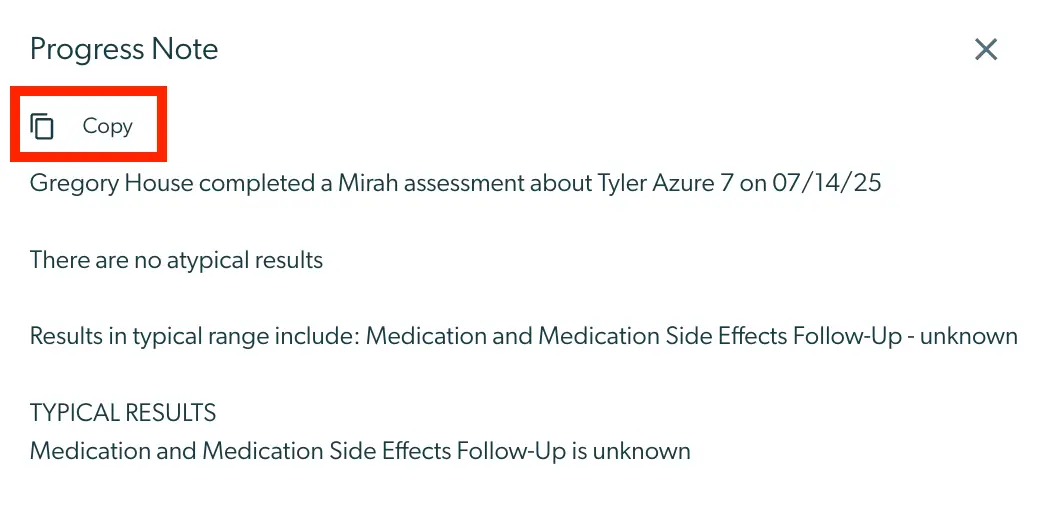
The screenshot displays a Progress Note from the Mirah Measurement-Based Care platform, detailing the completion of an assessment by Gregory House regarding Tyler Azure 7 on July 14, 2025. The note indicates that there are no atypical results and lists typical results, including medication and medication side effects follow-up, which are marked as unknown. A 'Copy' button is located at the top left corner, allowing users to copy the text of the progress note for further use. The button is represented by a clipboard icon followed by the text 'Copy'. The close button, represented by an 'X', is located at the top right corner of the screen.